Trase, 2025
Boosting user engagement by 30% on Trase
Brought in after Trase’s major site revamp to elevate the visual design, streamline the UX and introduce new workflows that improved the team’s process.
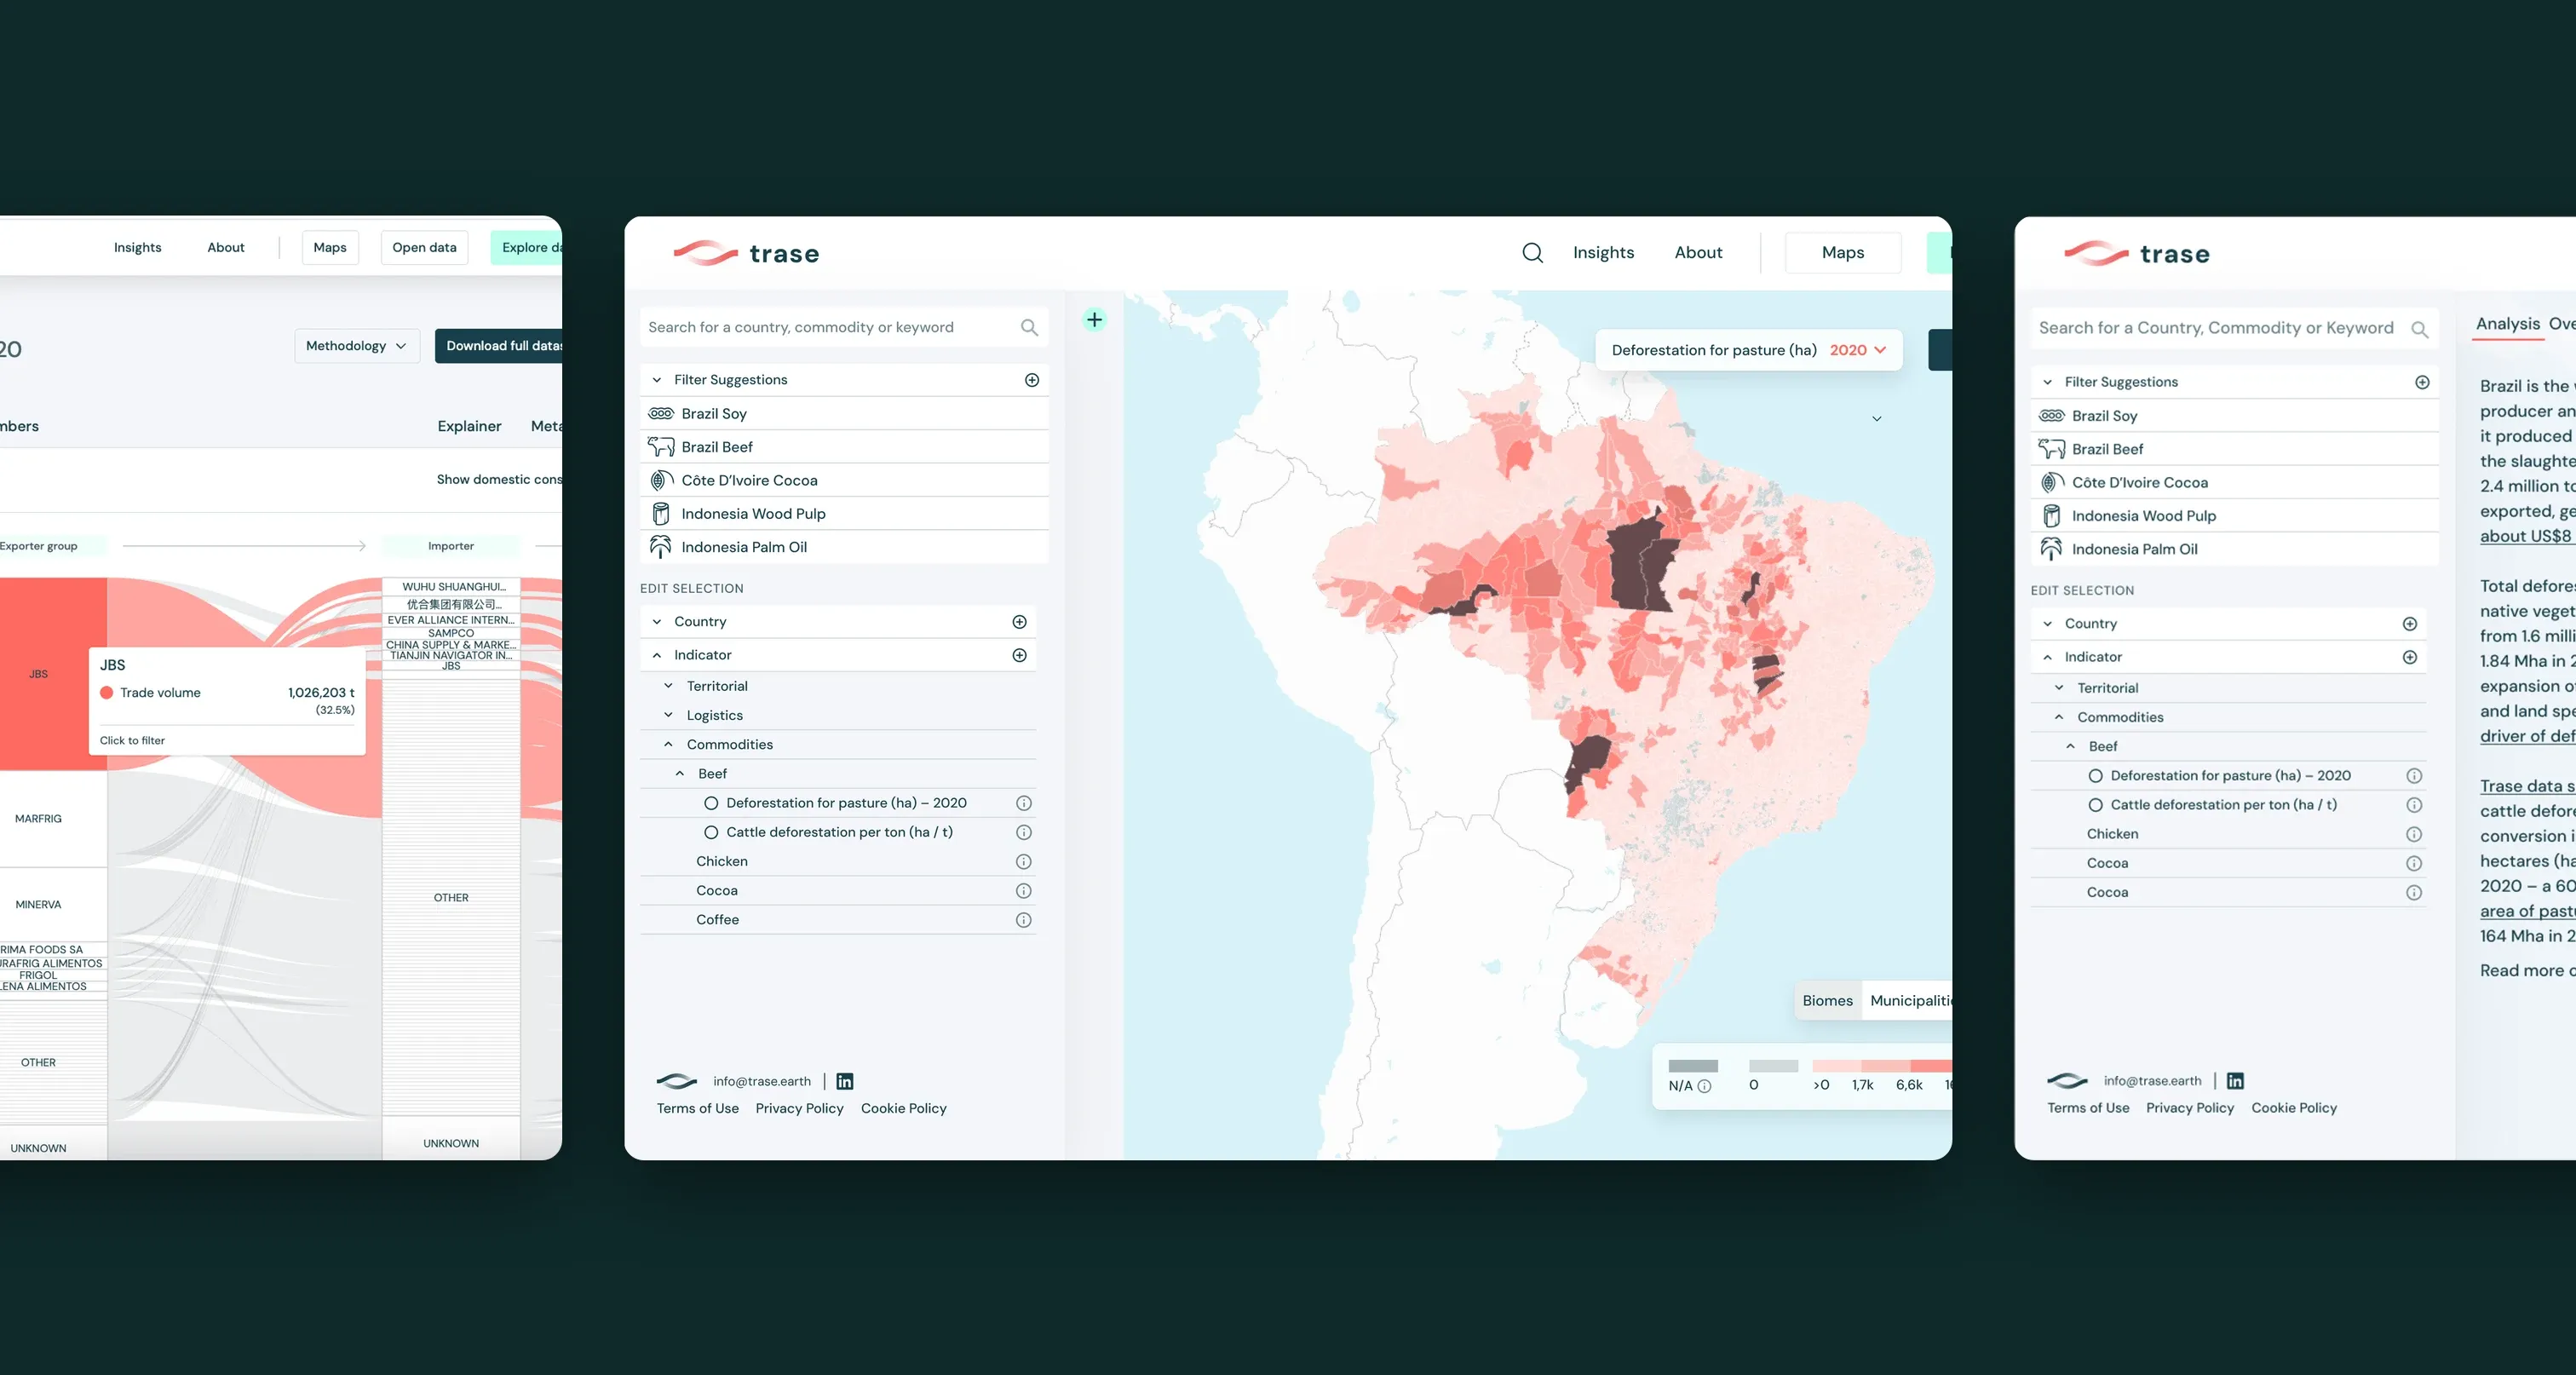
Overview
Making supply chain data easier to explore and act on
Trase is an open-access platform that brings transparency to the supply chains of key globally traded agricultural commodities. By connecting data sources in new ways, it links commodity buyers to the regions where products are grown, and to the sustainability risks and opportunities in those regions.
I joined as lead product designer after the site’s major revamp, to elevate the visual design, streamline the experience and introduce new workflows that improved the way the team worked. I partnered with the product manager and a software engineer day to day, and with Trase’s global researchers and data scientists across the wider organisation.
The impact
Over the year, active users more than doubled and the average engagement time per user grew by 30%, to almost six minutes.
Research
A continuous research programme, not a one-off study
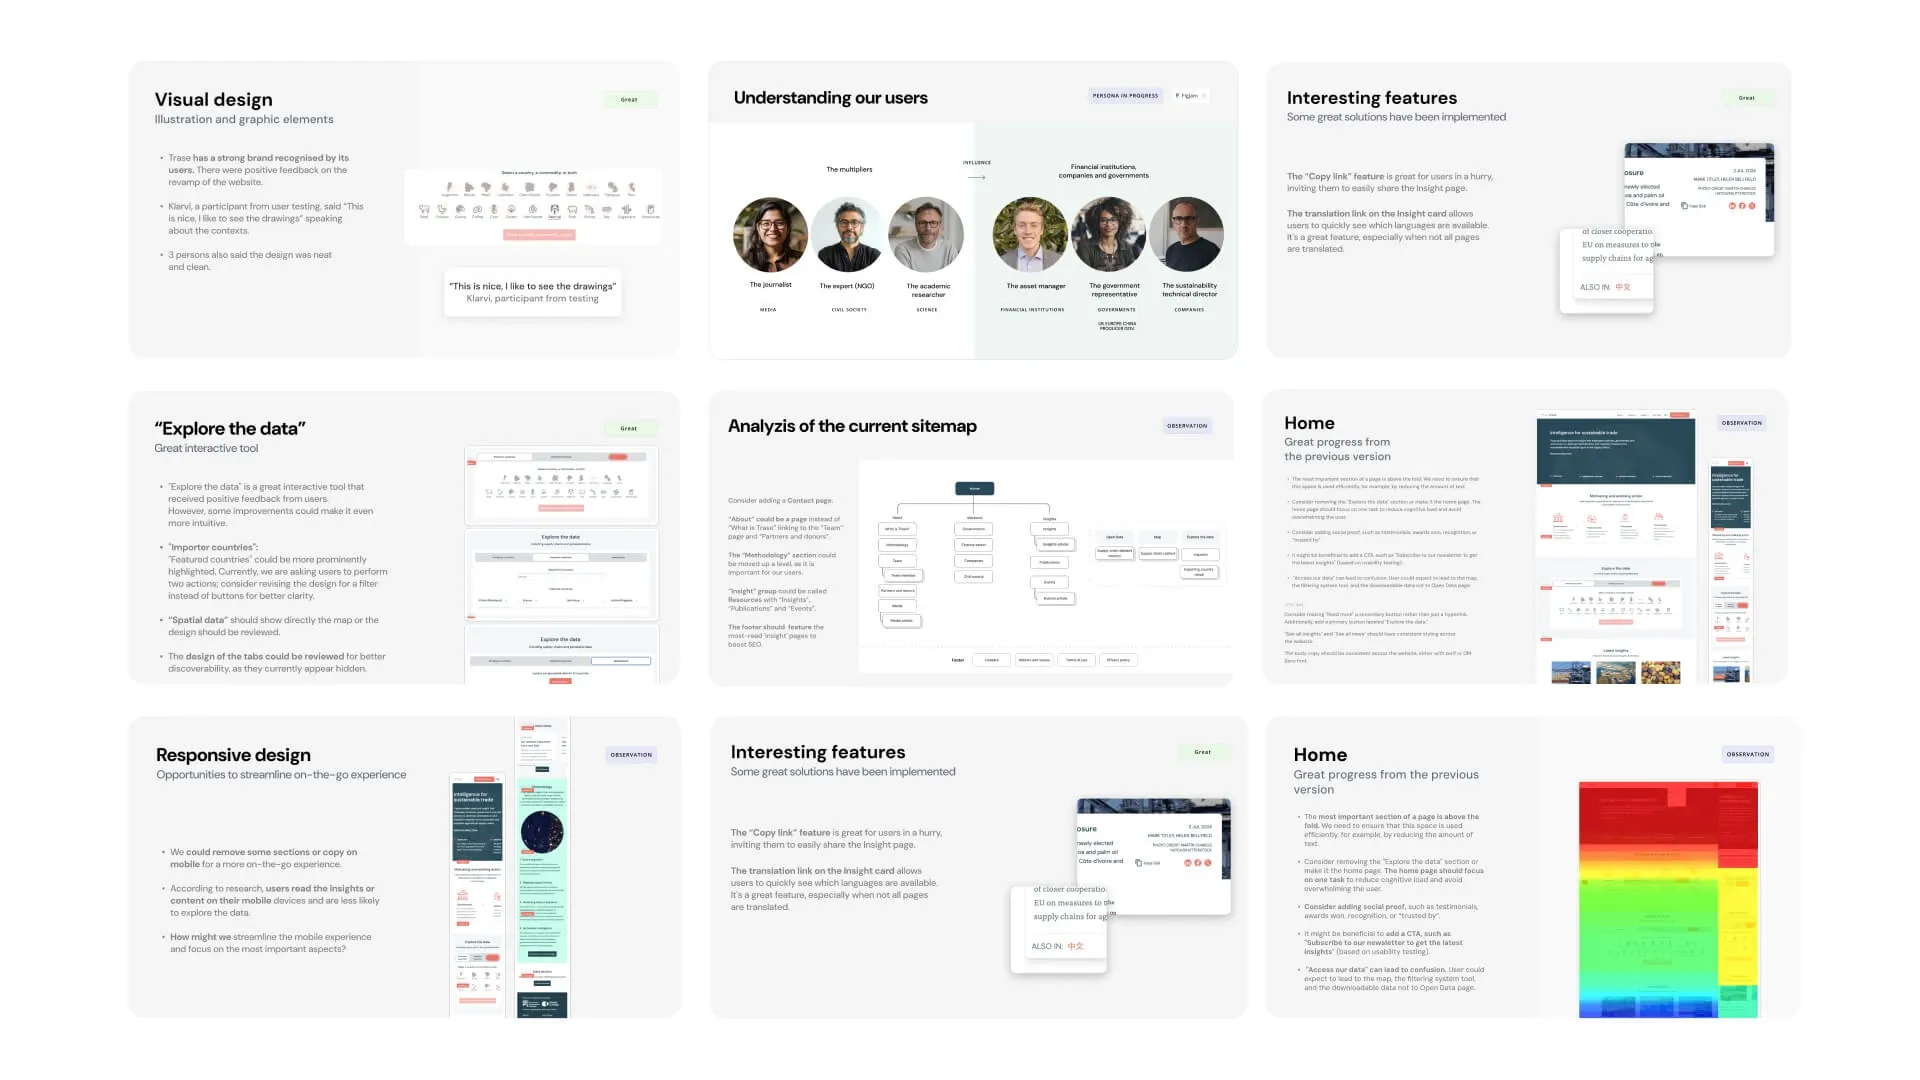
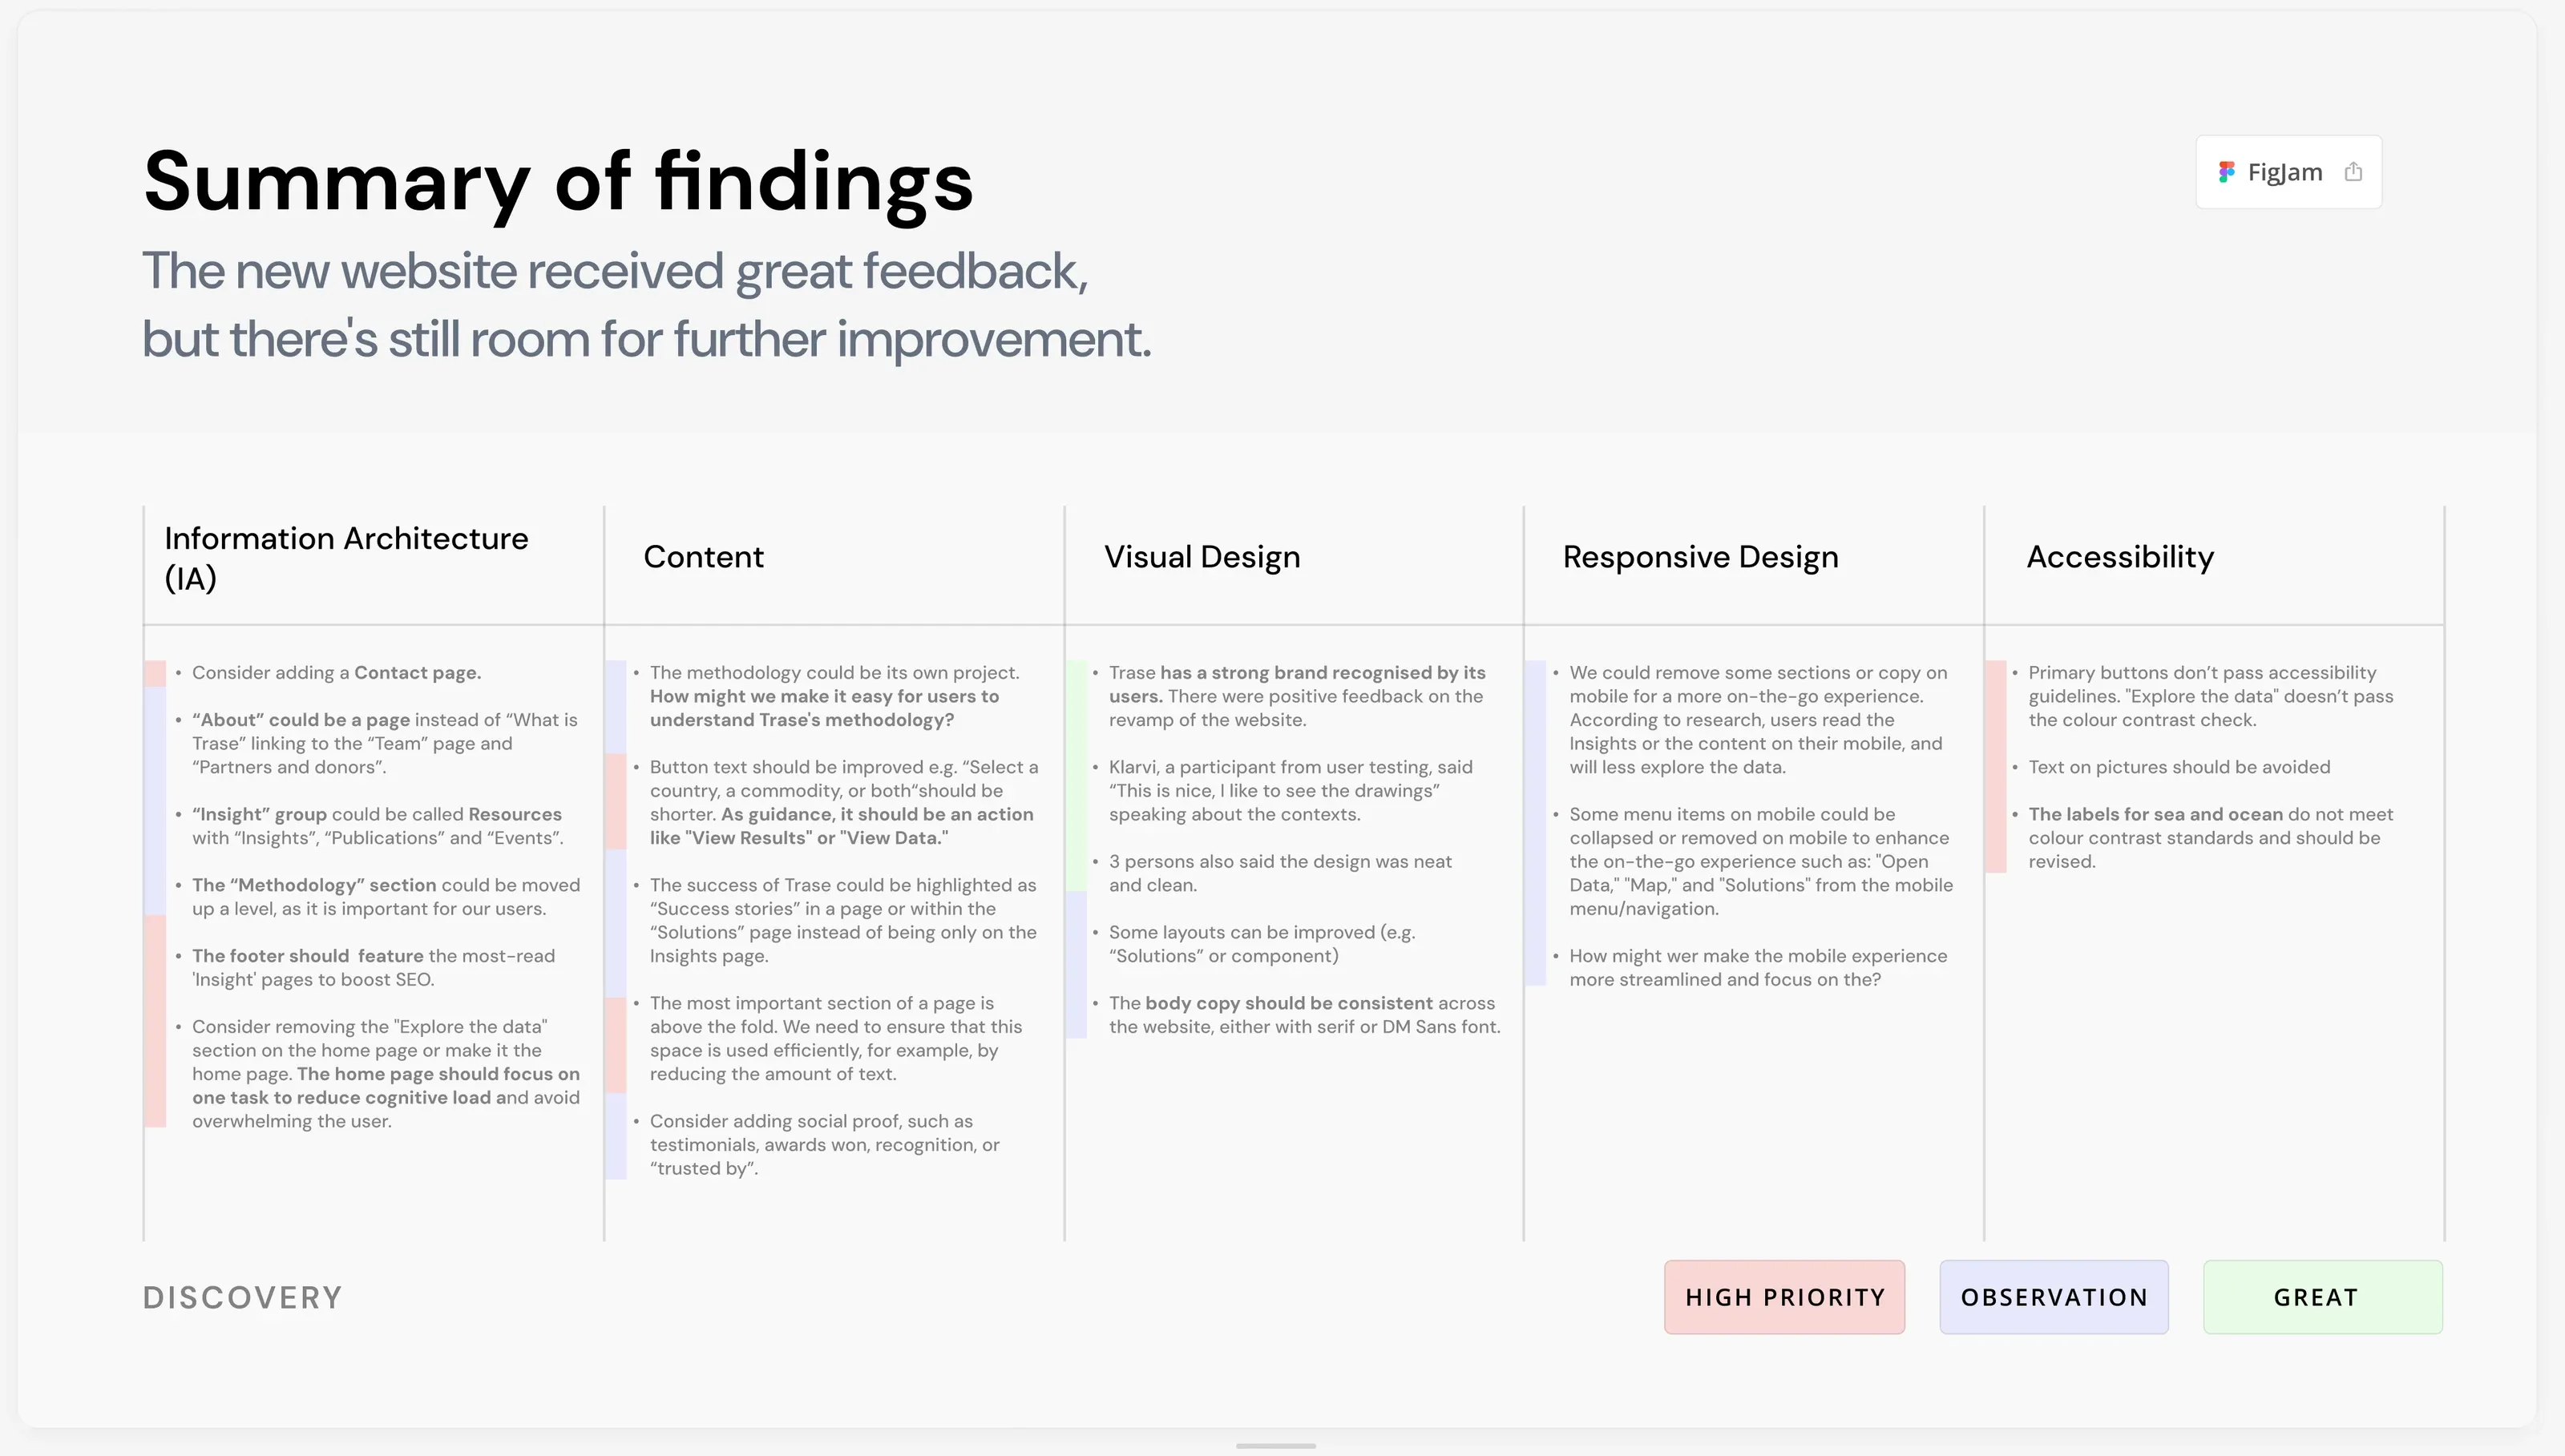
After a thorough audit, I set up a research programme that kept insights coming in all year.
Analytics and heatmaps
I set up Hotjar recordings and dashboards, reviewed Google Analytics every month and shared the findings with the wider team.User testing
I ran regular remote testing sessions with people who use Trase data in their work.Workshops
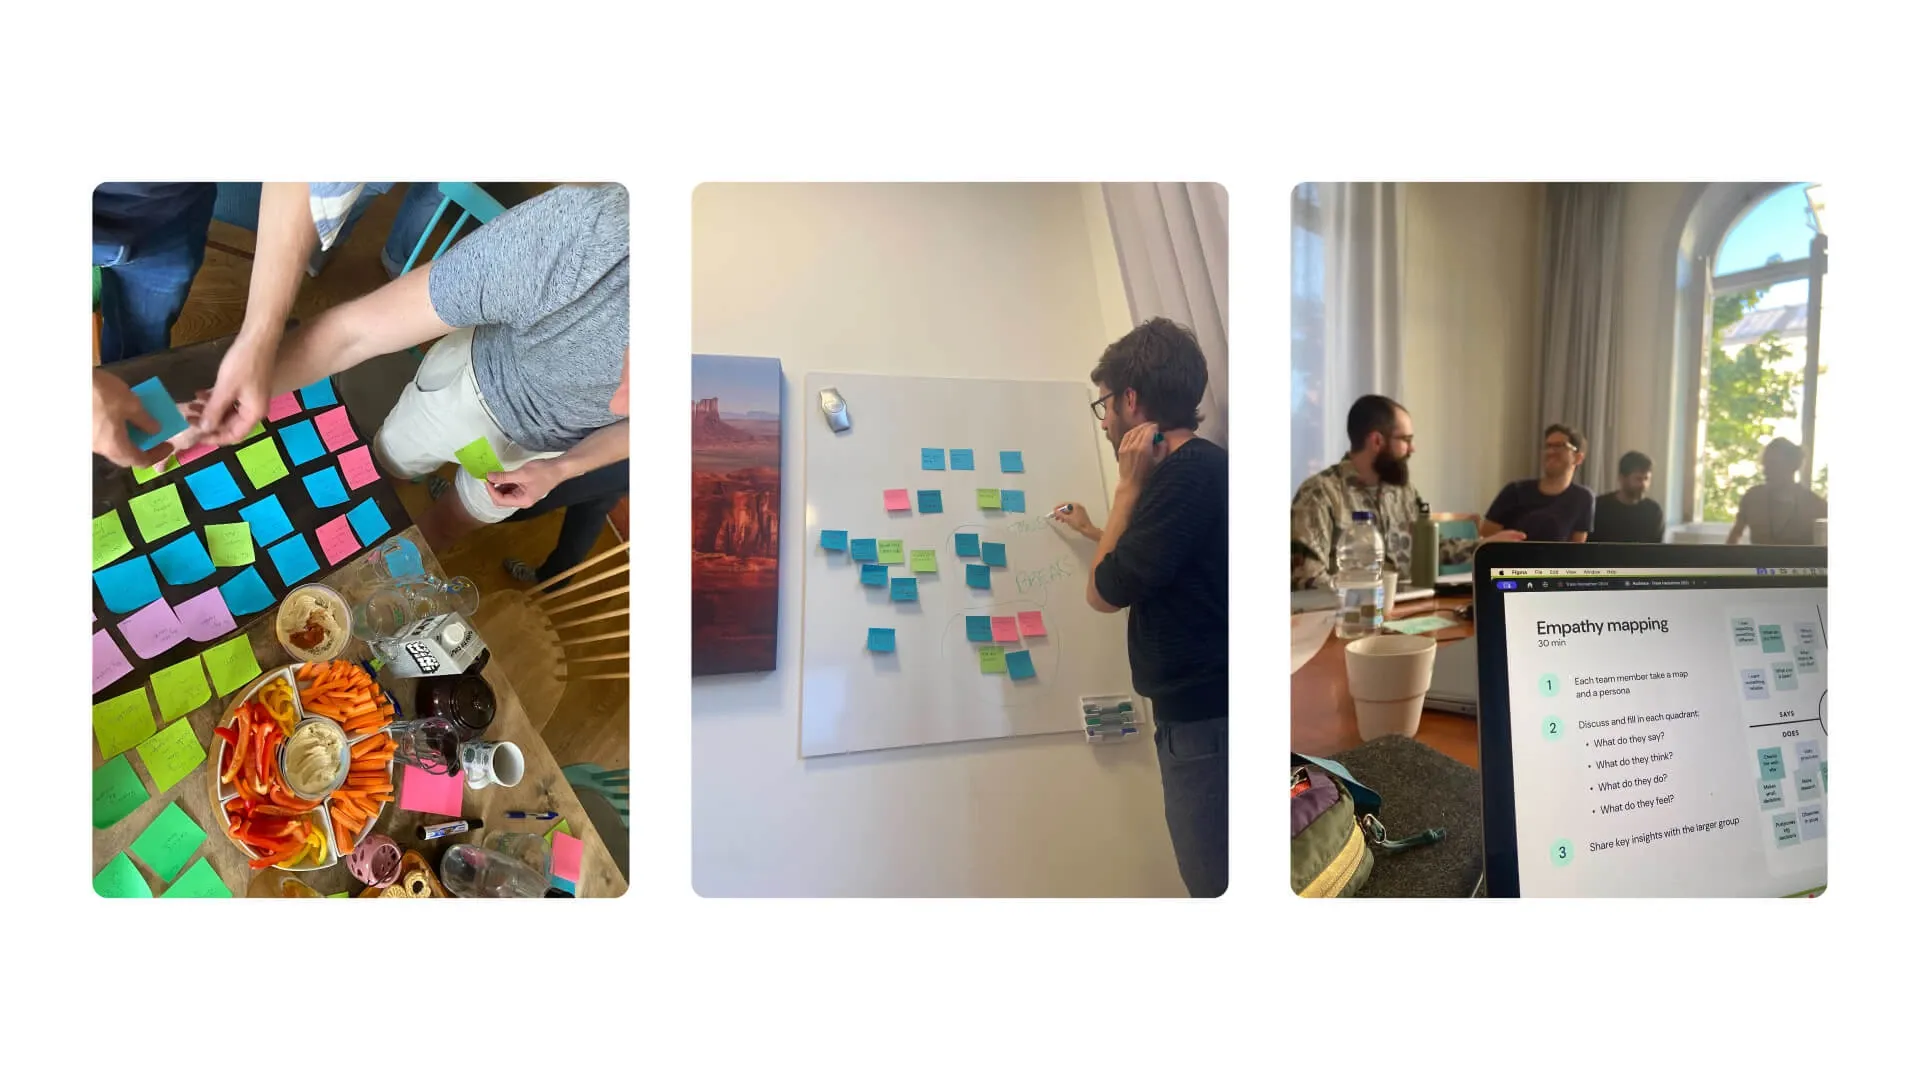
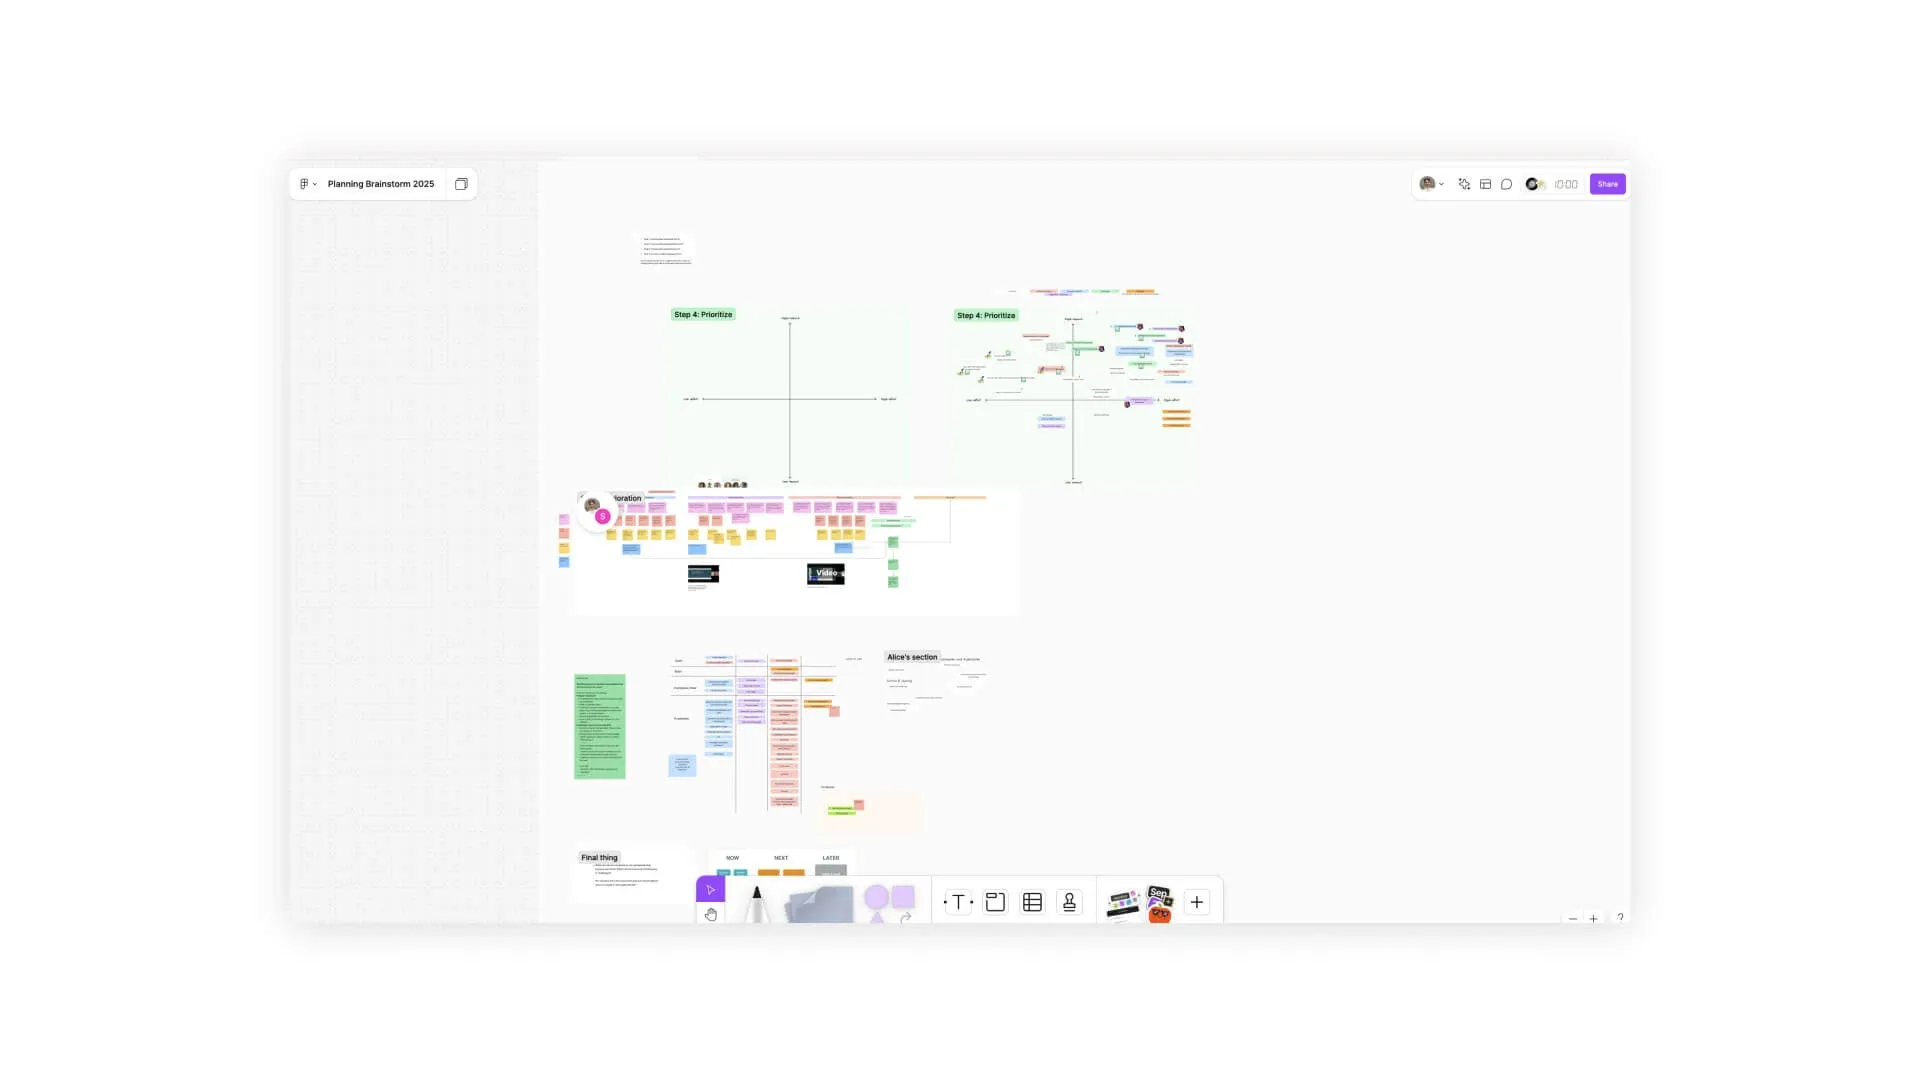
I facilitated in-person workshops in Stockholm and remote FigJam sessions to uncover pain points and prioritise features.
Data
Explore the data: making results clear and usable
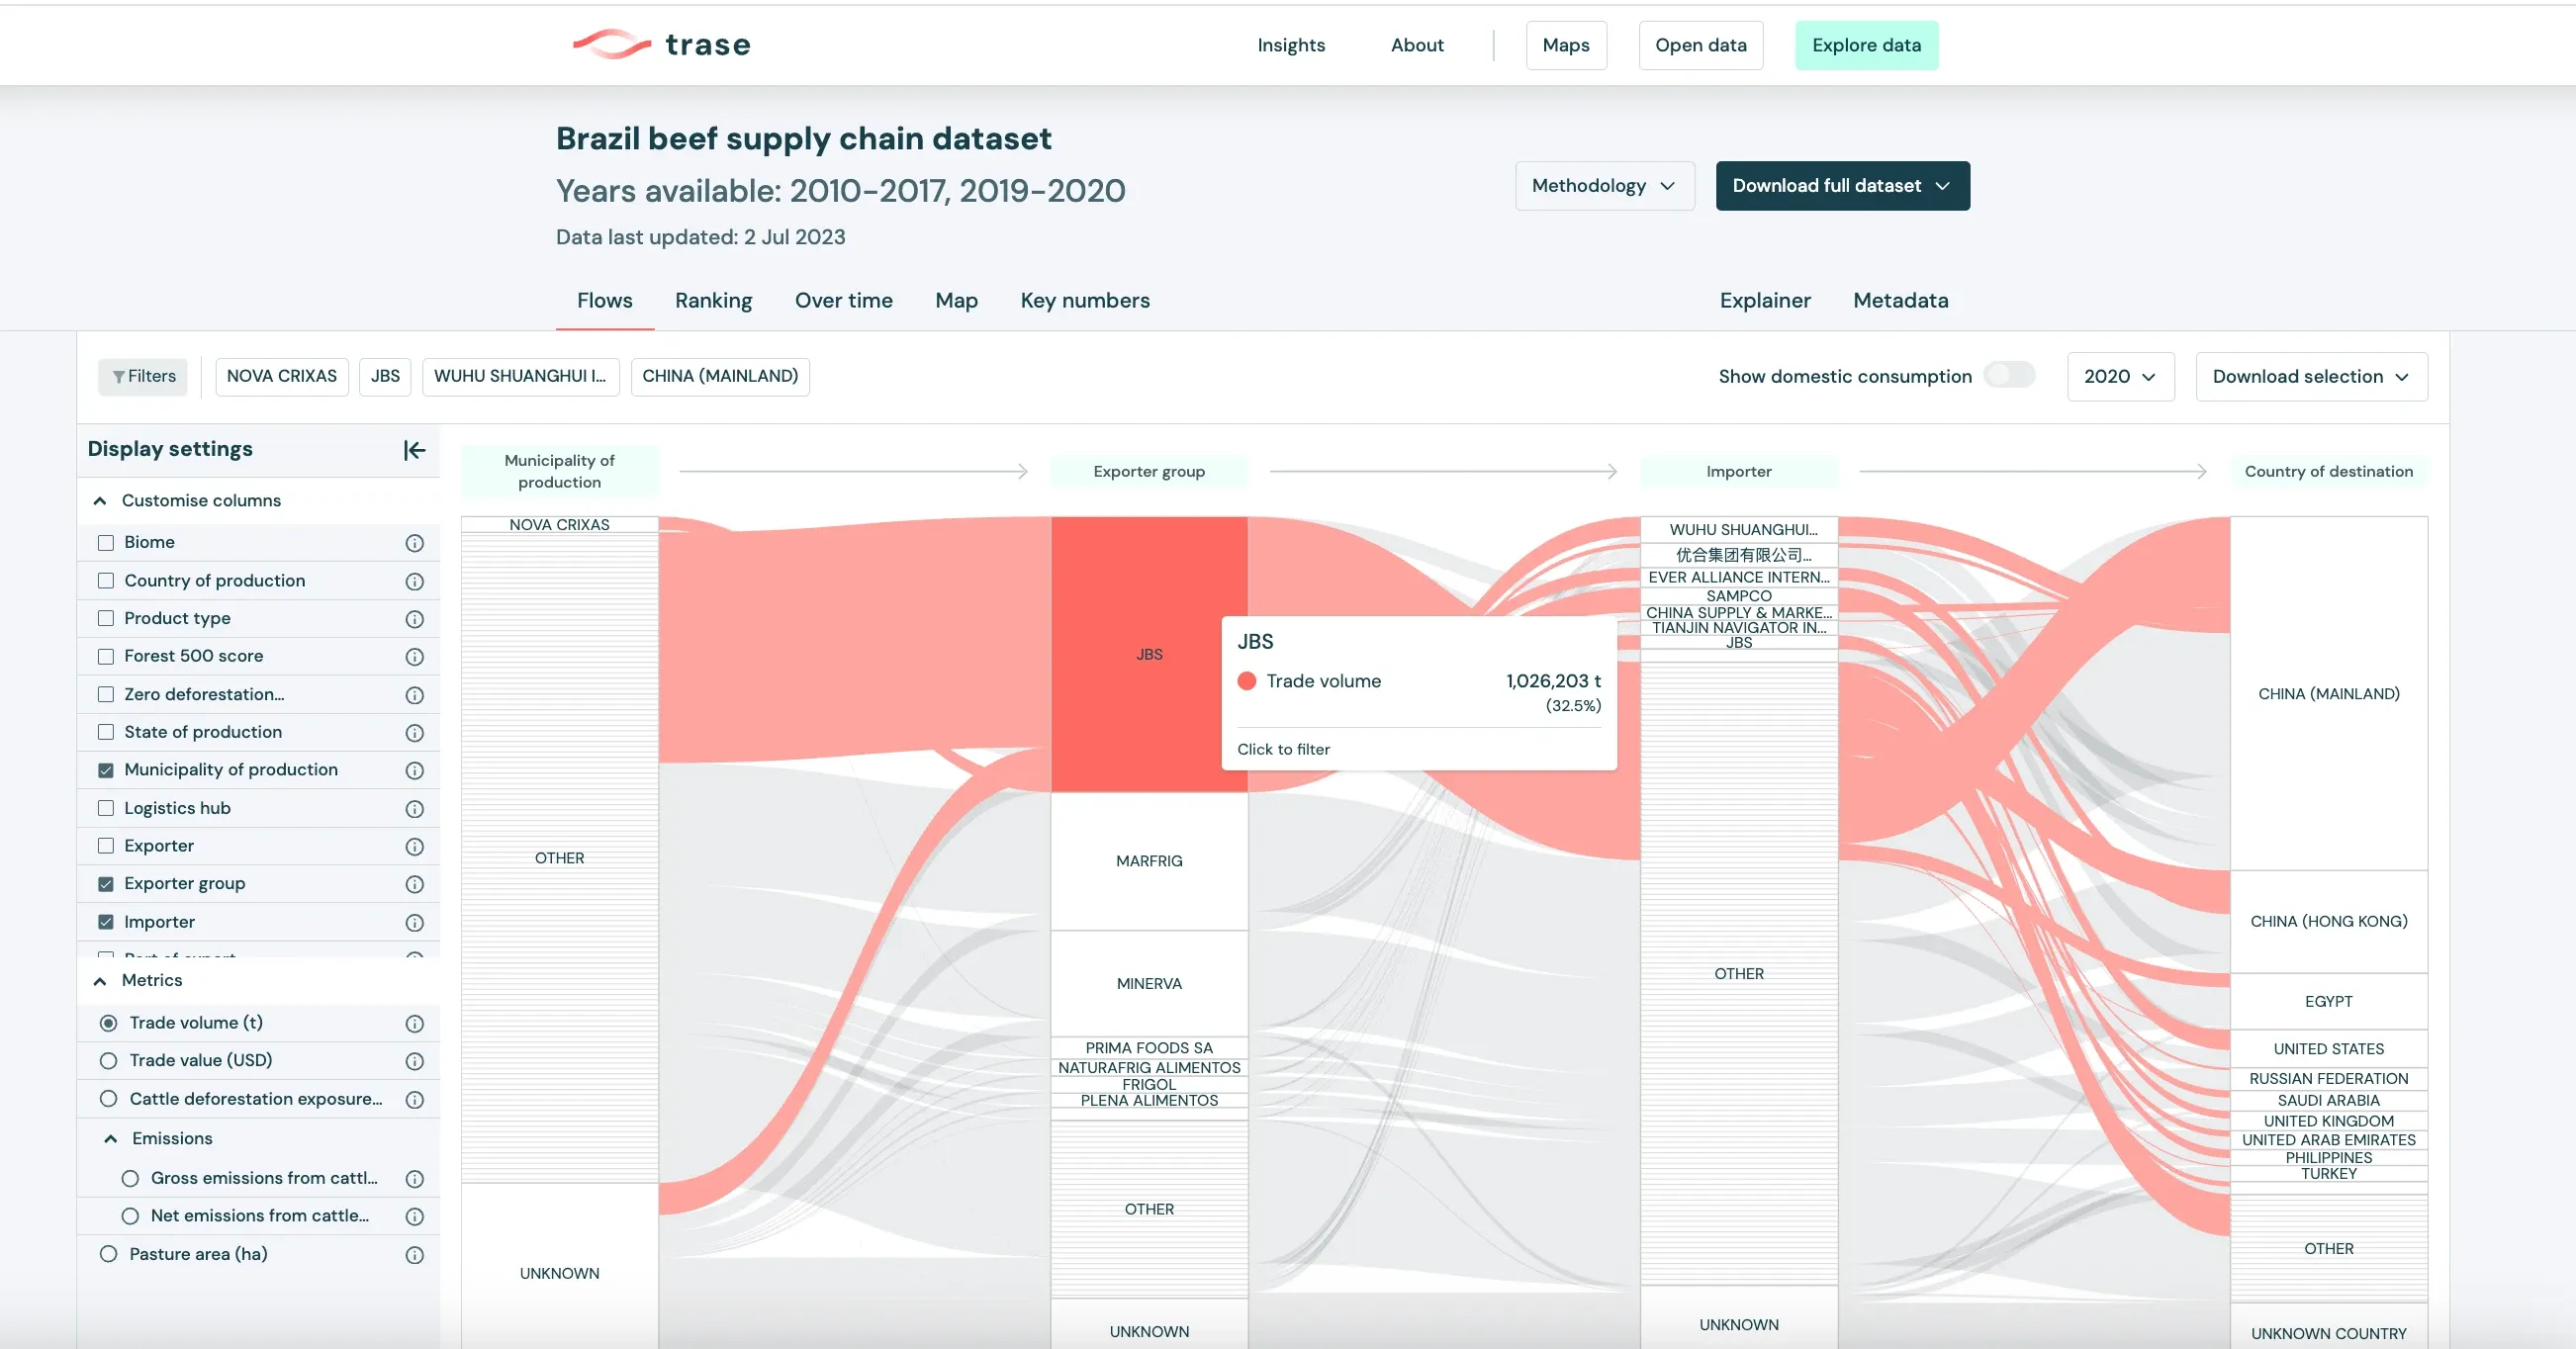
People struggled to understand and engage with the results of “Explore the data”. Key results were crowded, hard to find and had no guidance around them, so users got confused and missed insights.
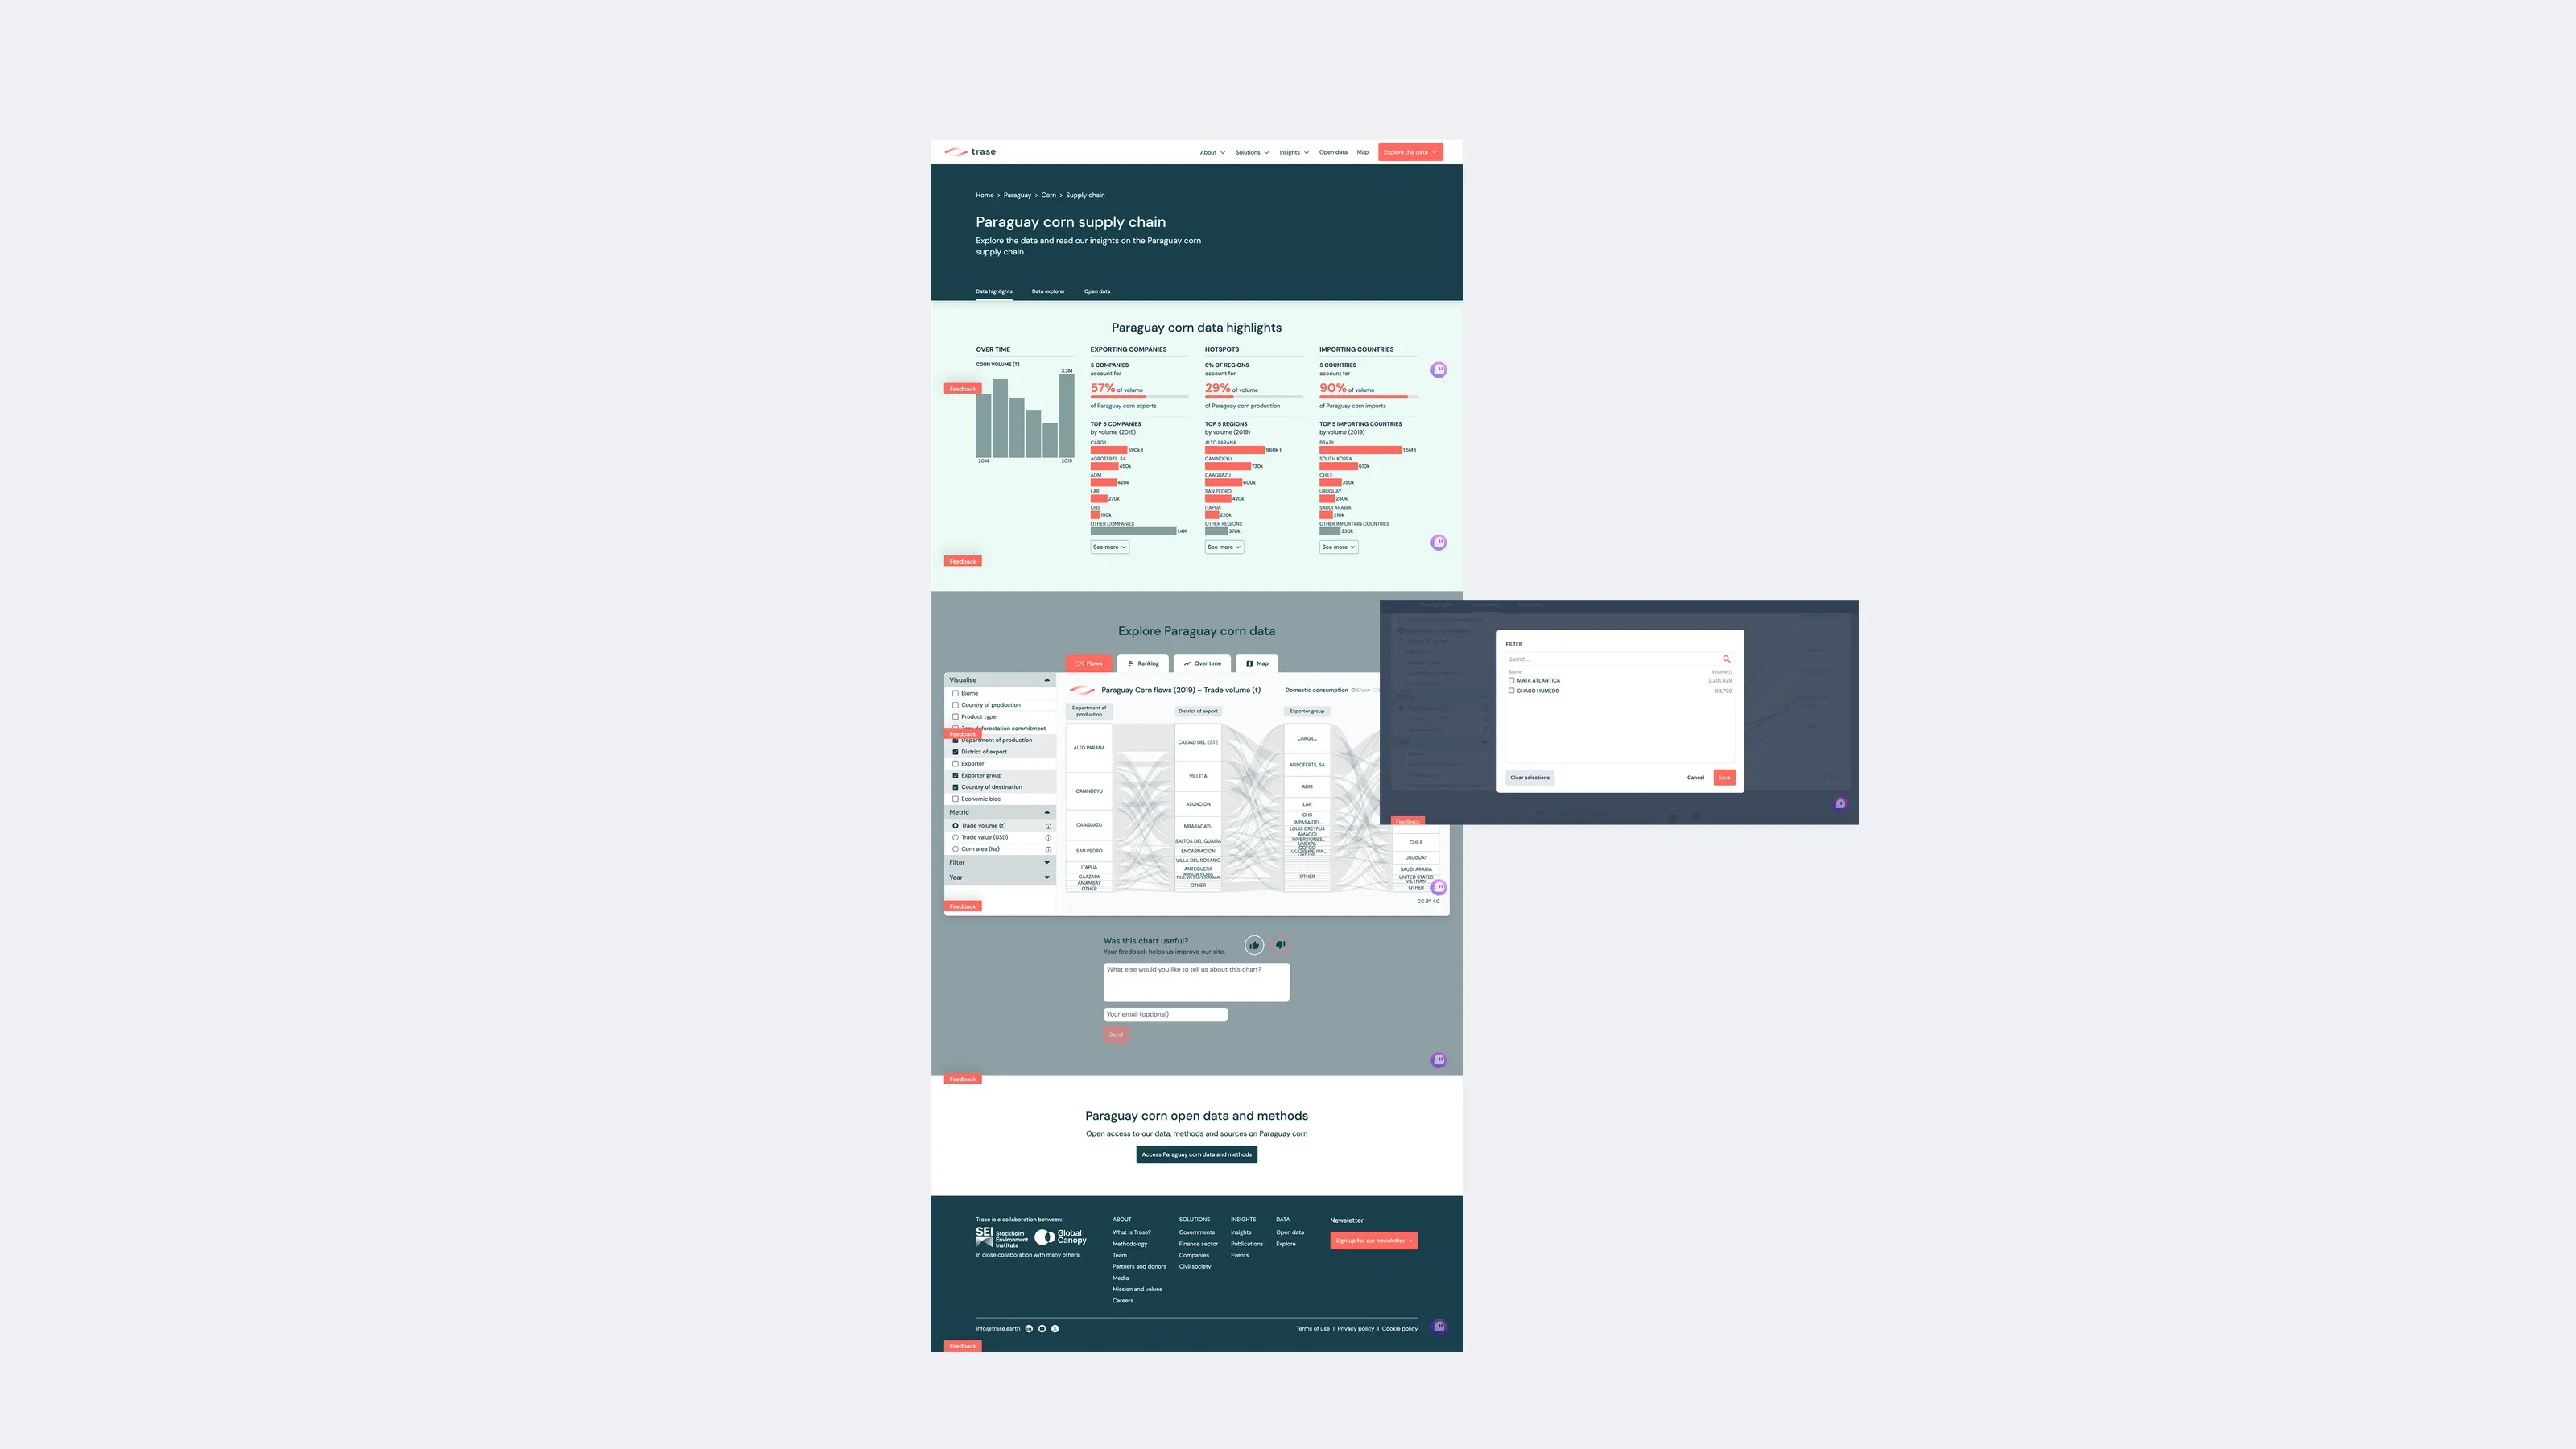
In the redesigned experience, users land directly on the flow map, so experienced users get to the insight straight away. Contextual tooltips appear at the right moments and guide everyone else through the tool with clarity and confidence.
Map
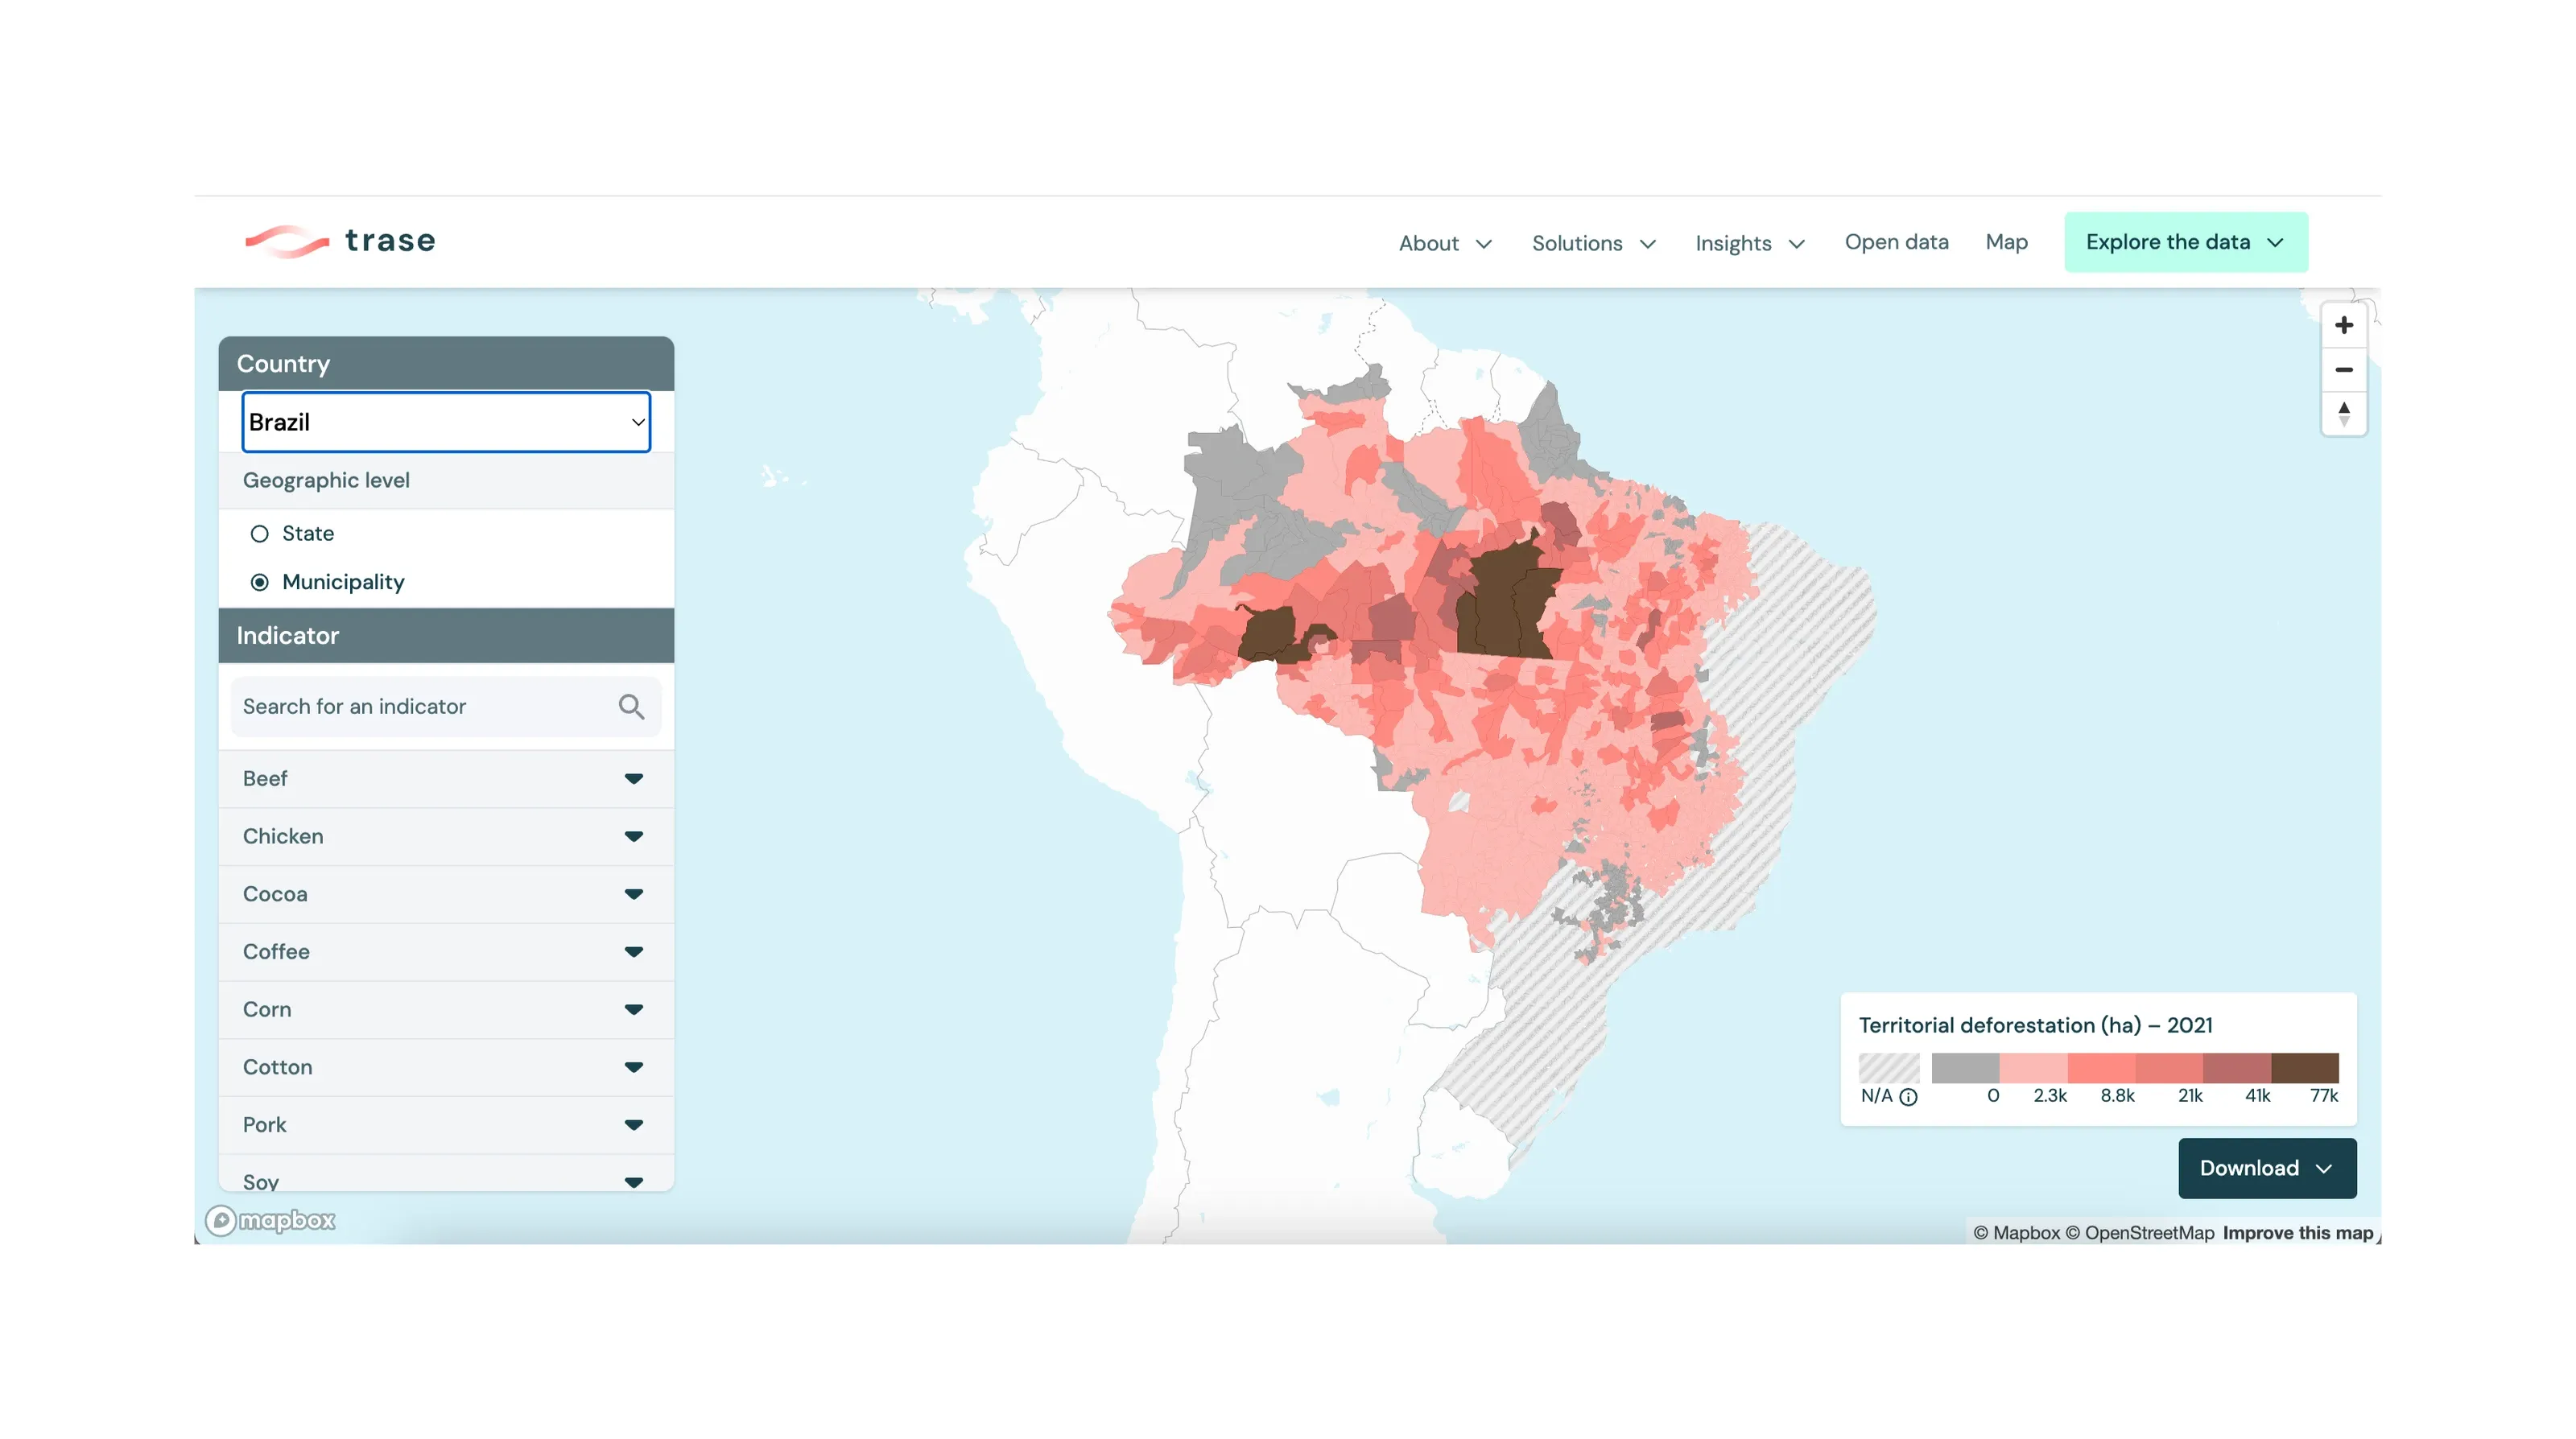
A faster way to filter and compare regions
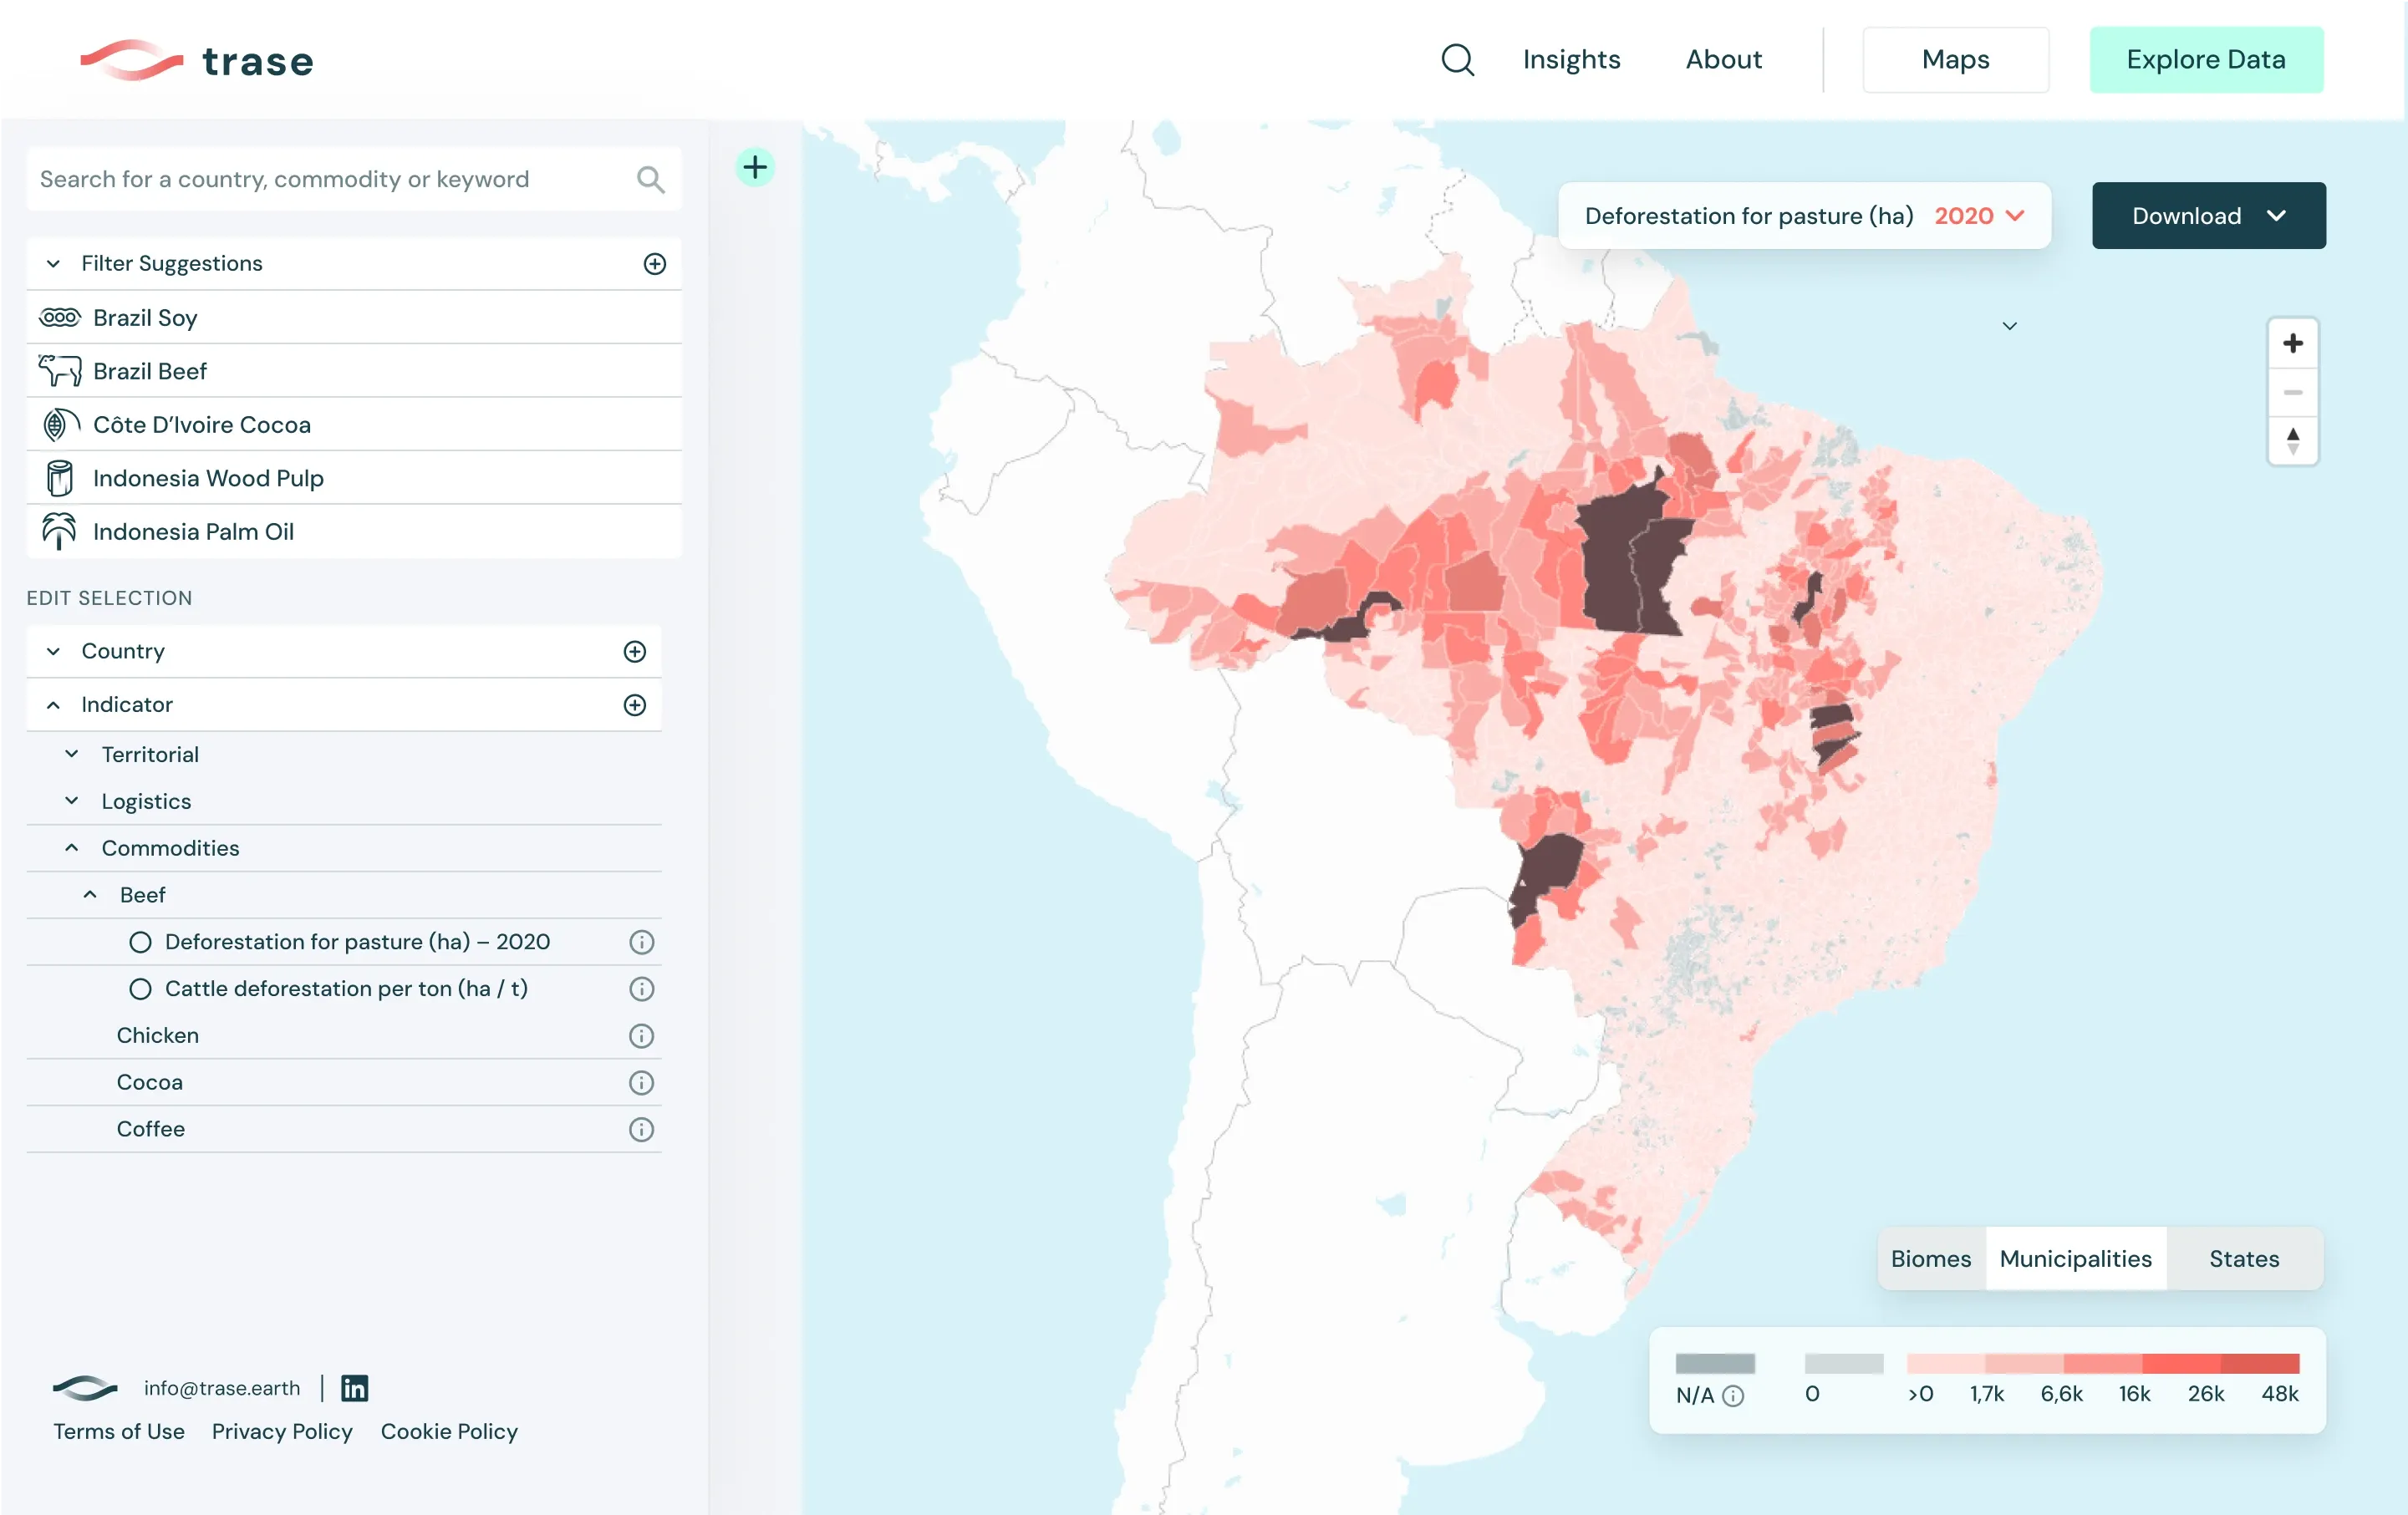
Filtering the map was clunky and took too many steps. I introduced preset filters, a persistent side navigation and a simpler toolbar, so users can explore and compare regions in two clicks.
Navigation
Clearer navigation, built to be accessible
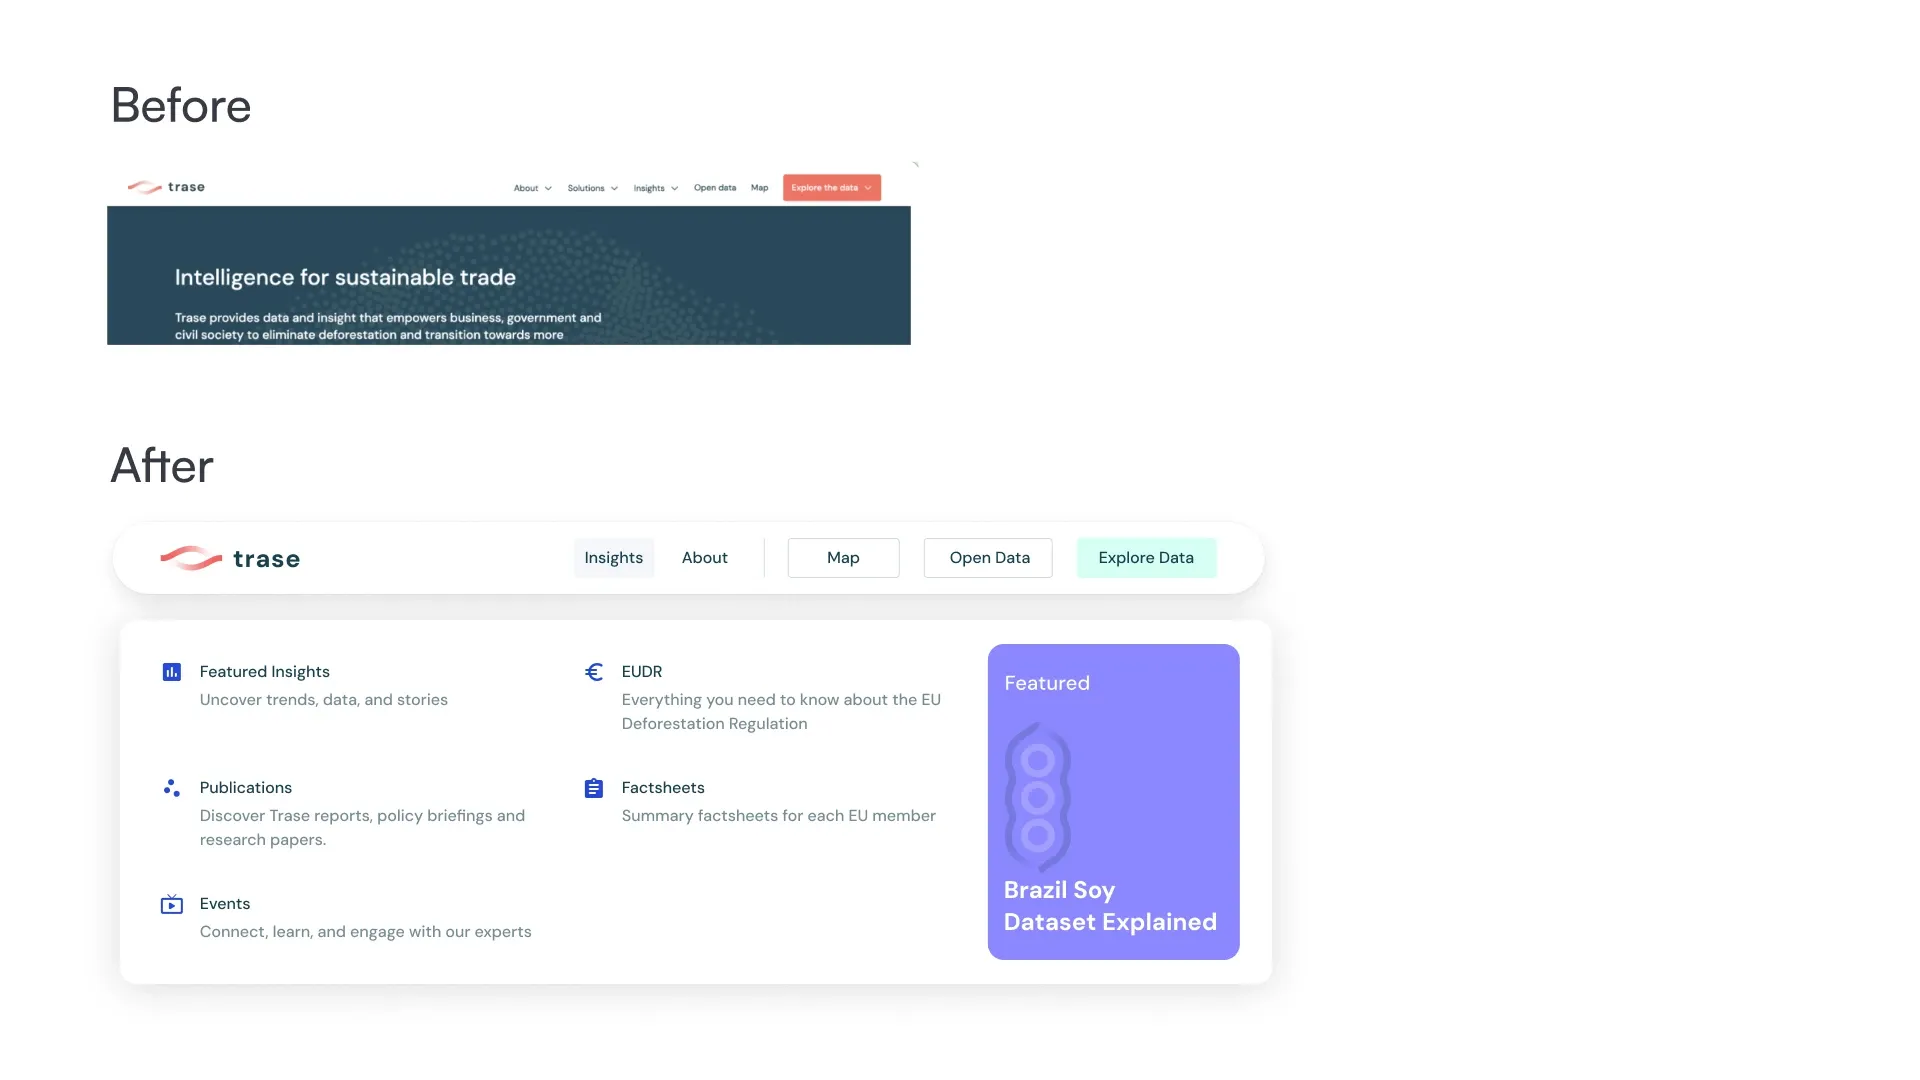
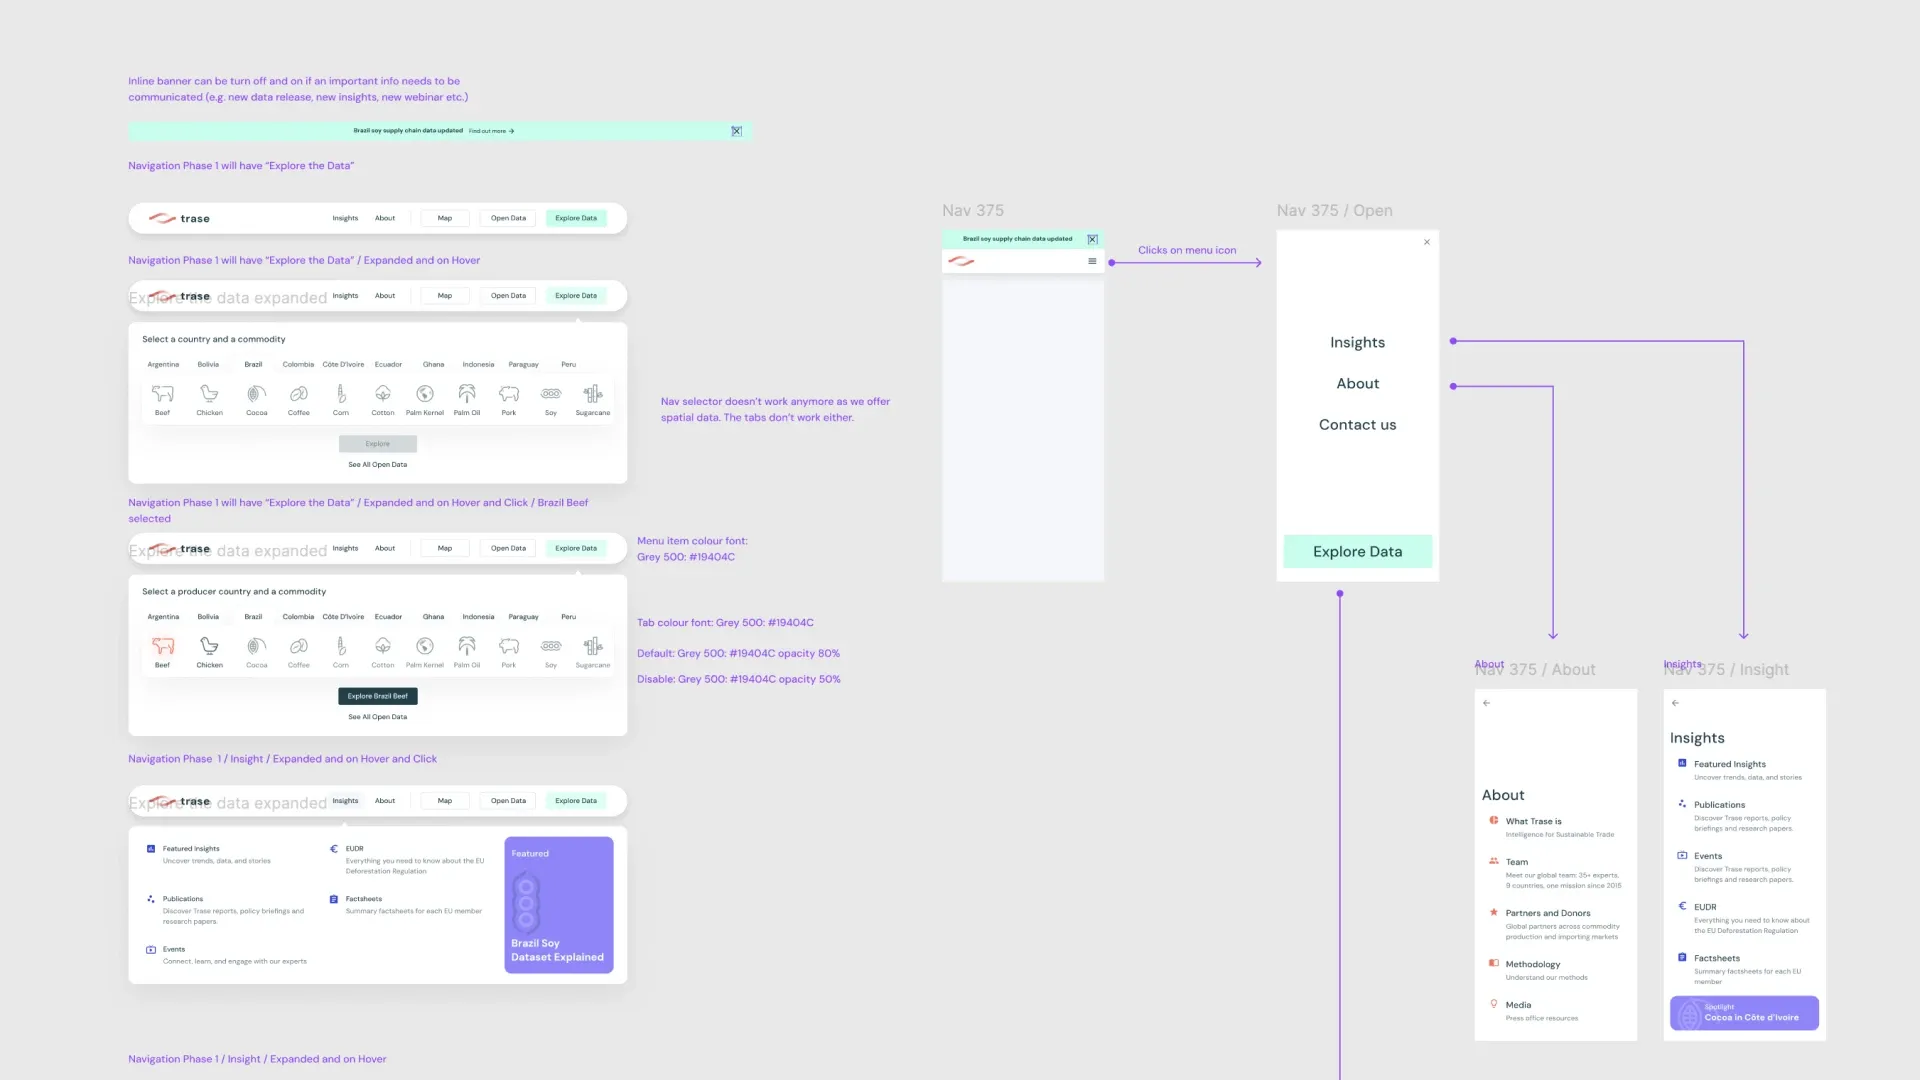
The site navigation was confusing. I rebuilt the global navigation to show Trase’s core offering clearly and let people go straight to Insights, About or the data itself, on desktop and on mobile.
Improving accessibility
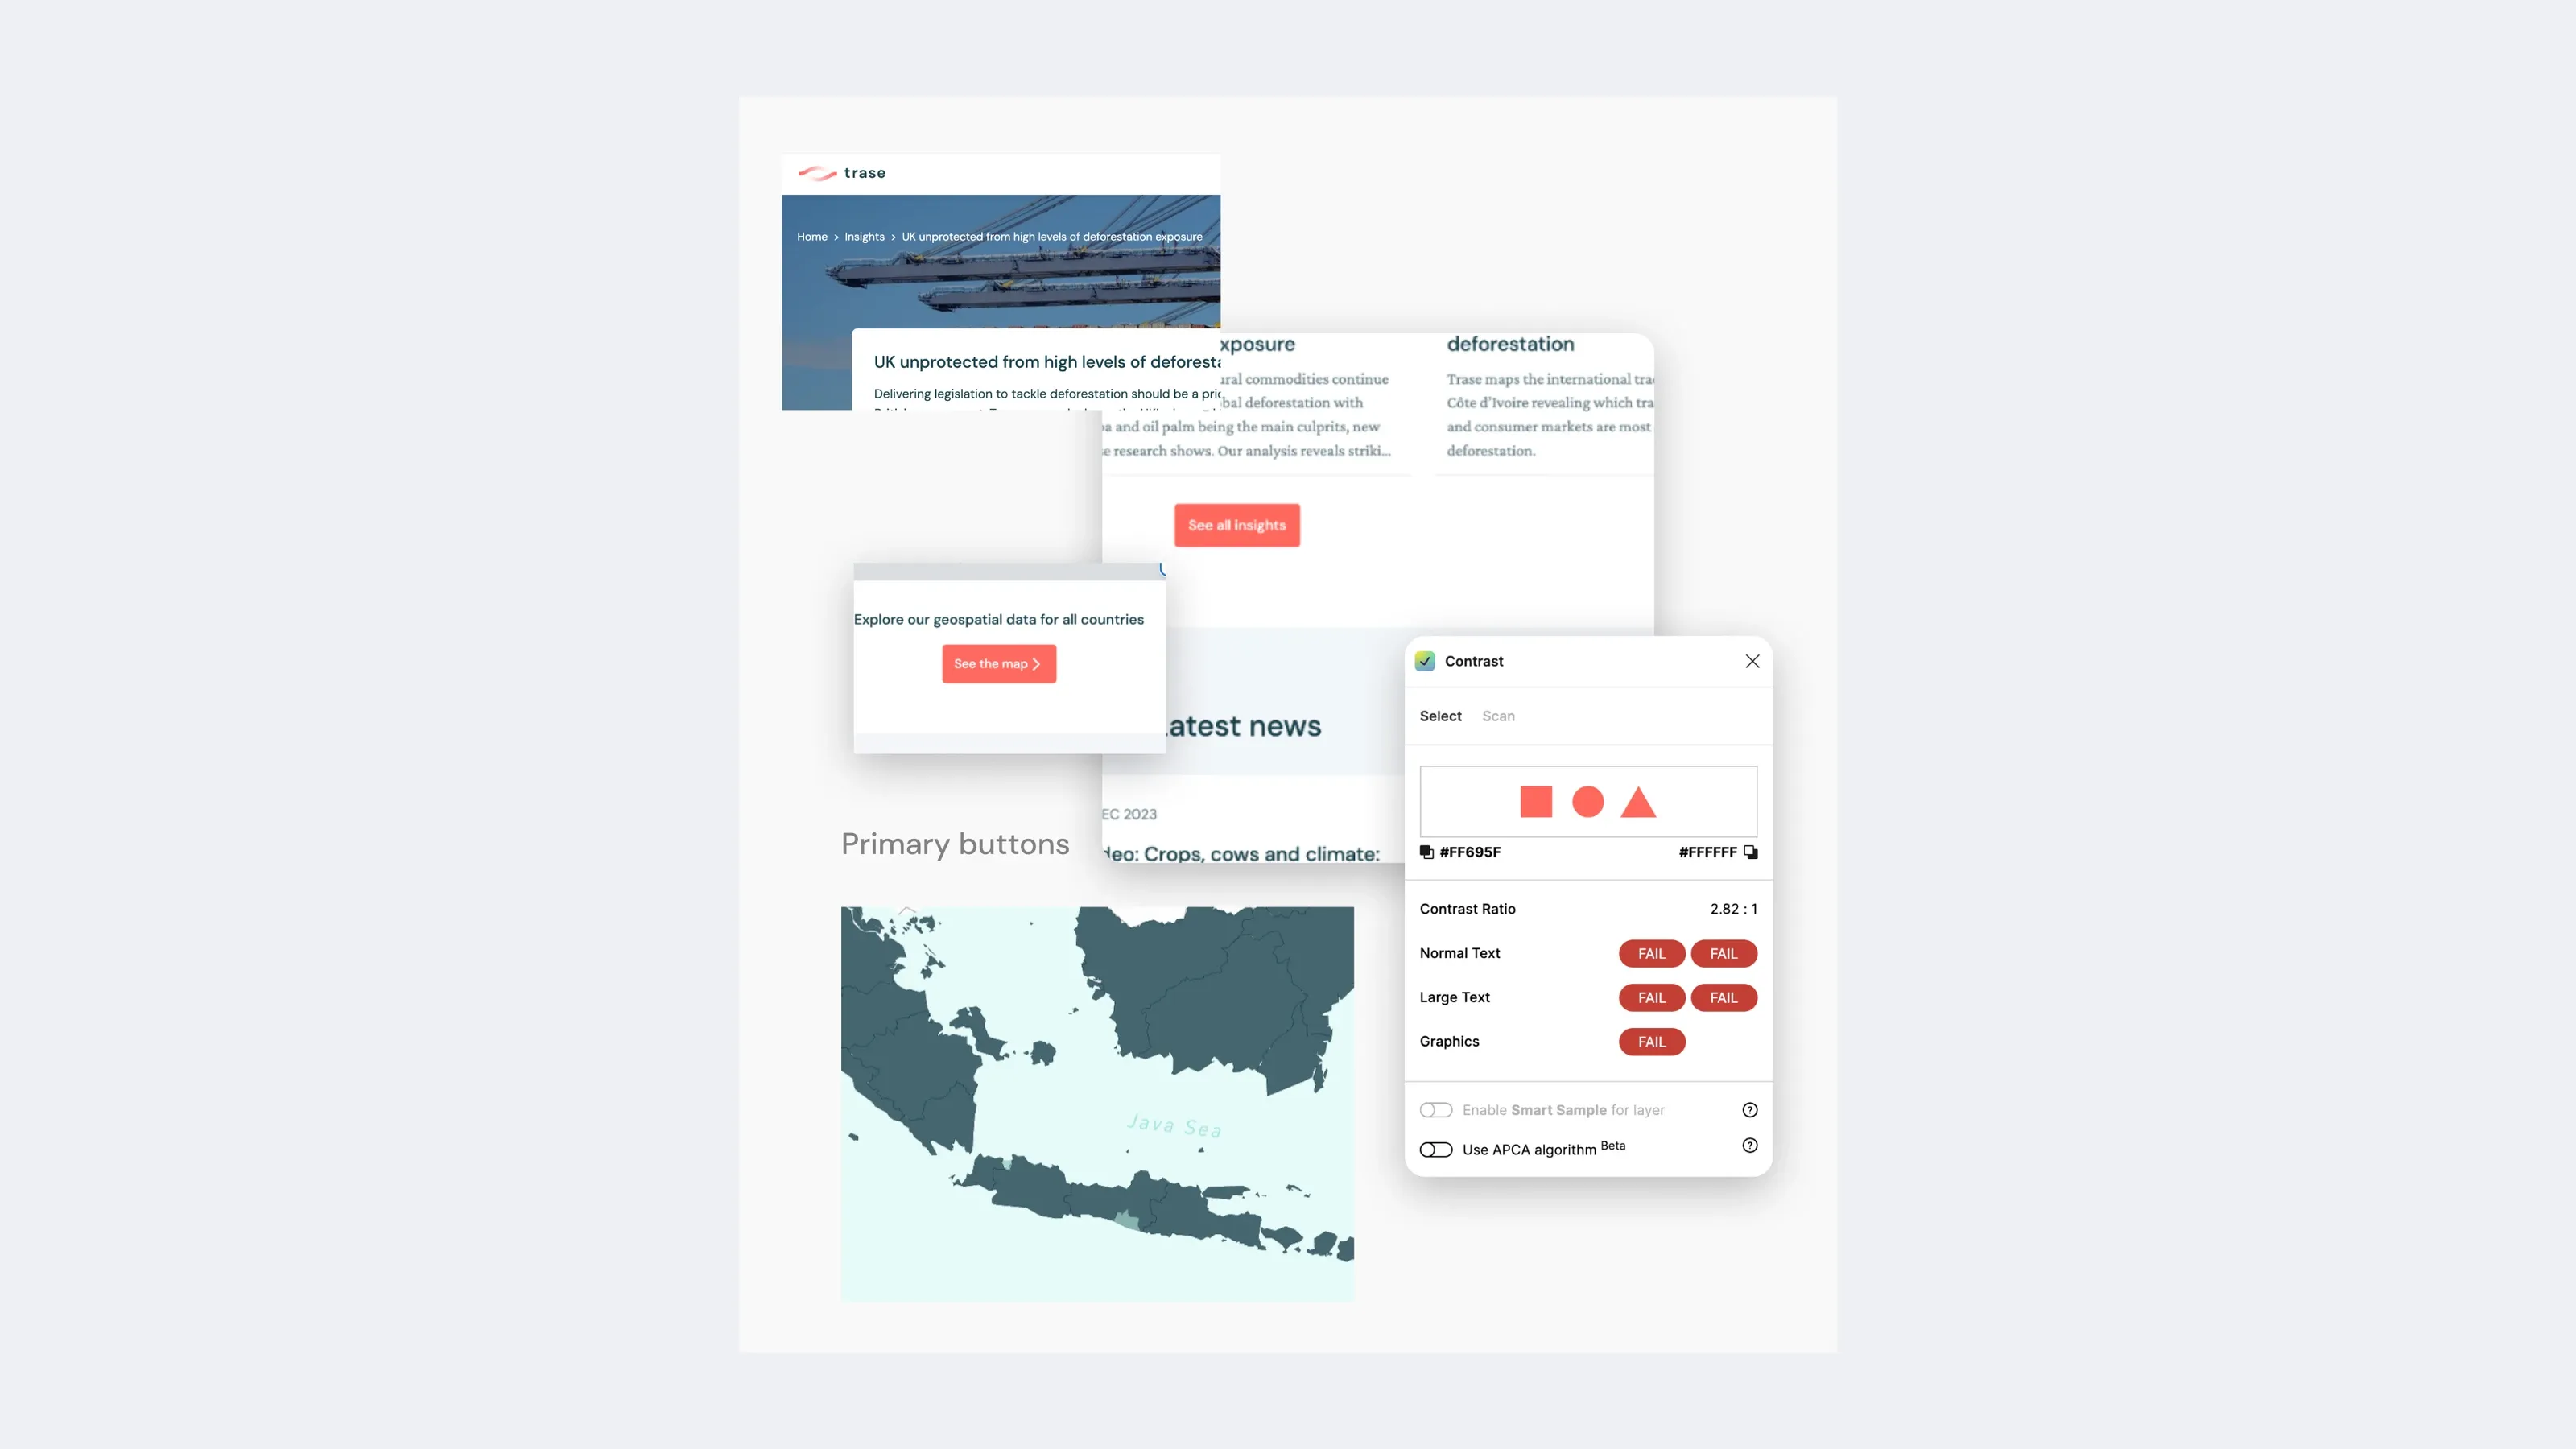
Some of the colours failed accessibility guidelines. I applied WCAG-compliant contrast, keyboard navigation and screen-reader-friendly labels to the menu.
Result
More people, staying longer, going deeper
Over the year, traffic went up, and so did the depth and quality of engagement and user satisfaction.
Active users up 145.6%
Now around 11K, with roughly 2.5 times as many returning users as the previous period: people find real value in the platform.
New users up 154.6%
More than twice as many first-time visitors are discovering Trase, which is driving the growth in active users.
Engagement time up 30%
The average engaged time per active user is now 5 min 53 s, showing that people are going deeper into the data.