PRODA, 2024
Streamlining operating statement data for real estate investment teams
Lead product designer at PRODA, working with the PM, engineers and PRODA’s design team on a new flow for uploading, checking and reviewing operating statement data.
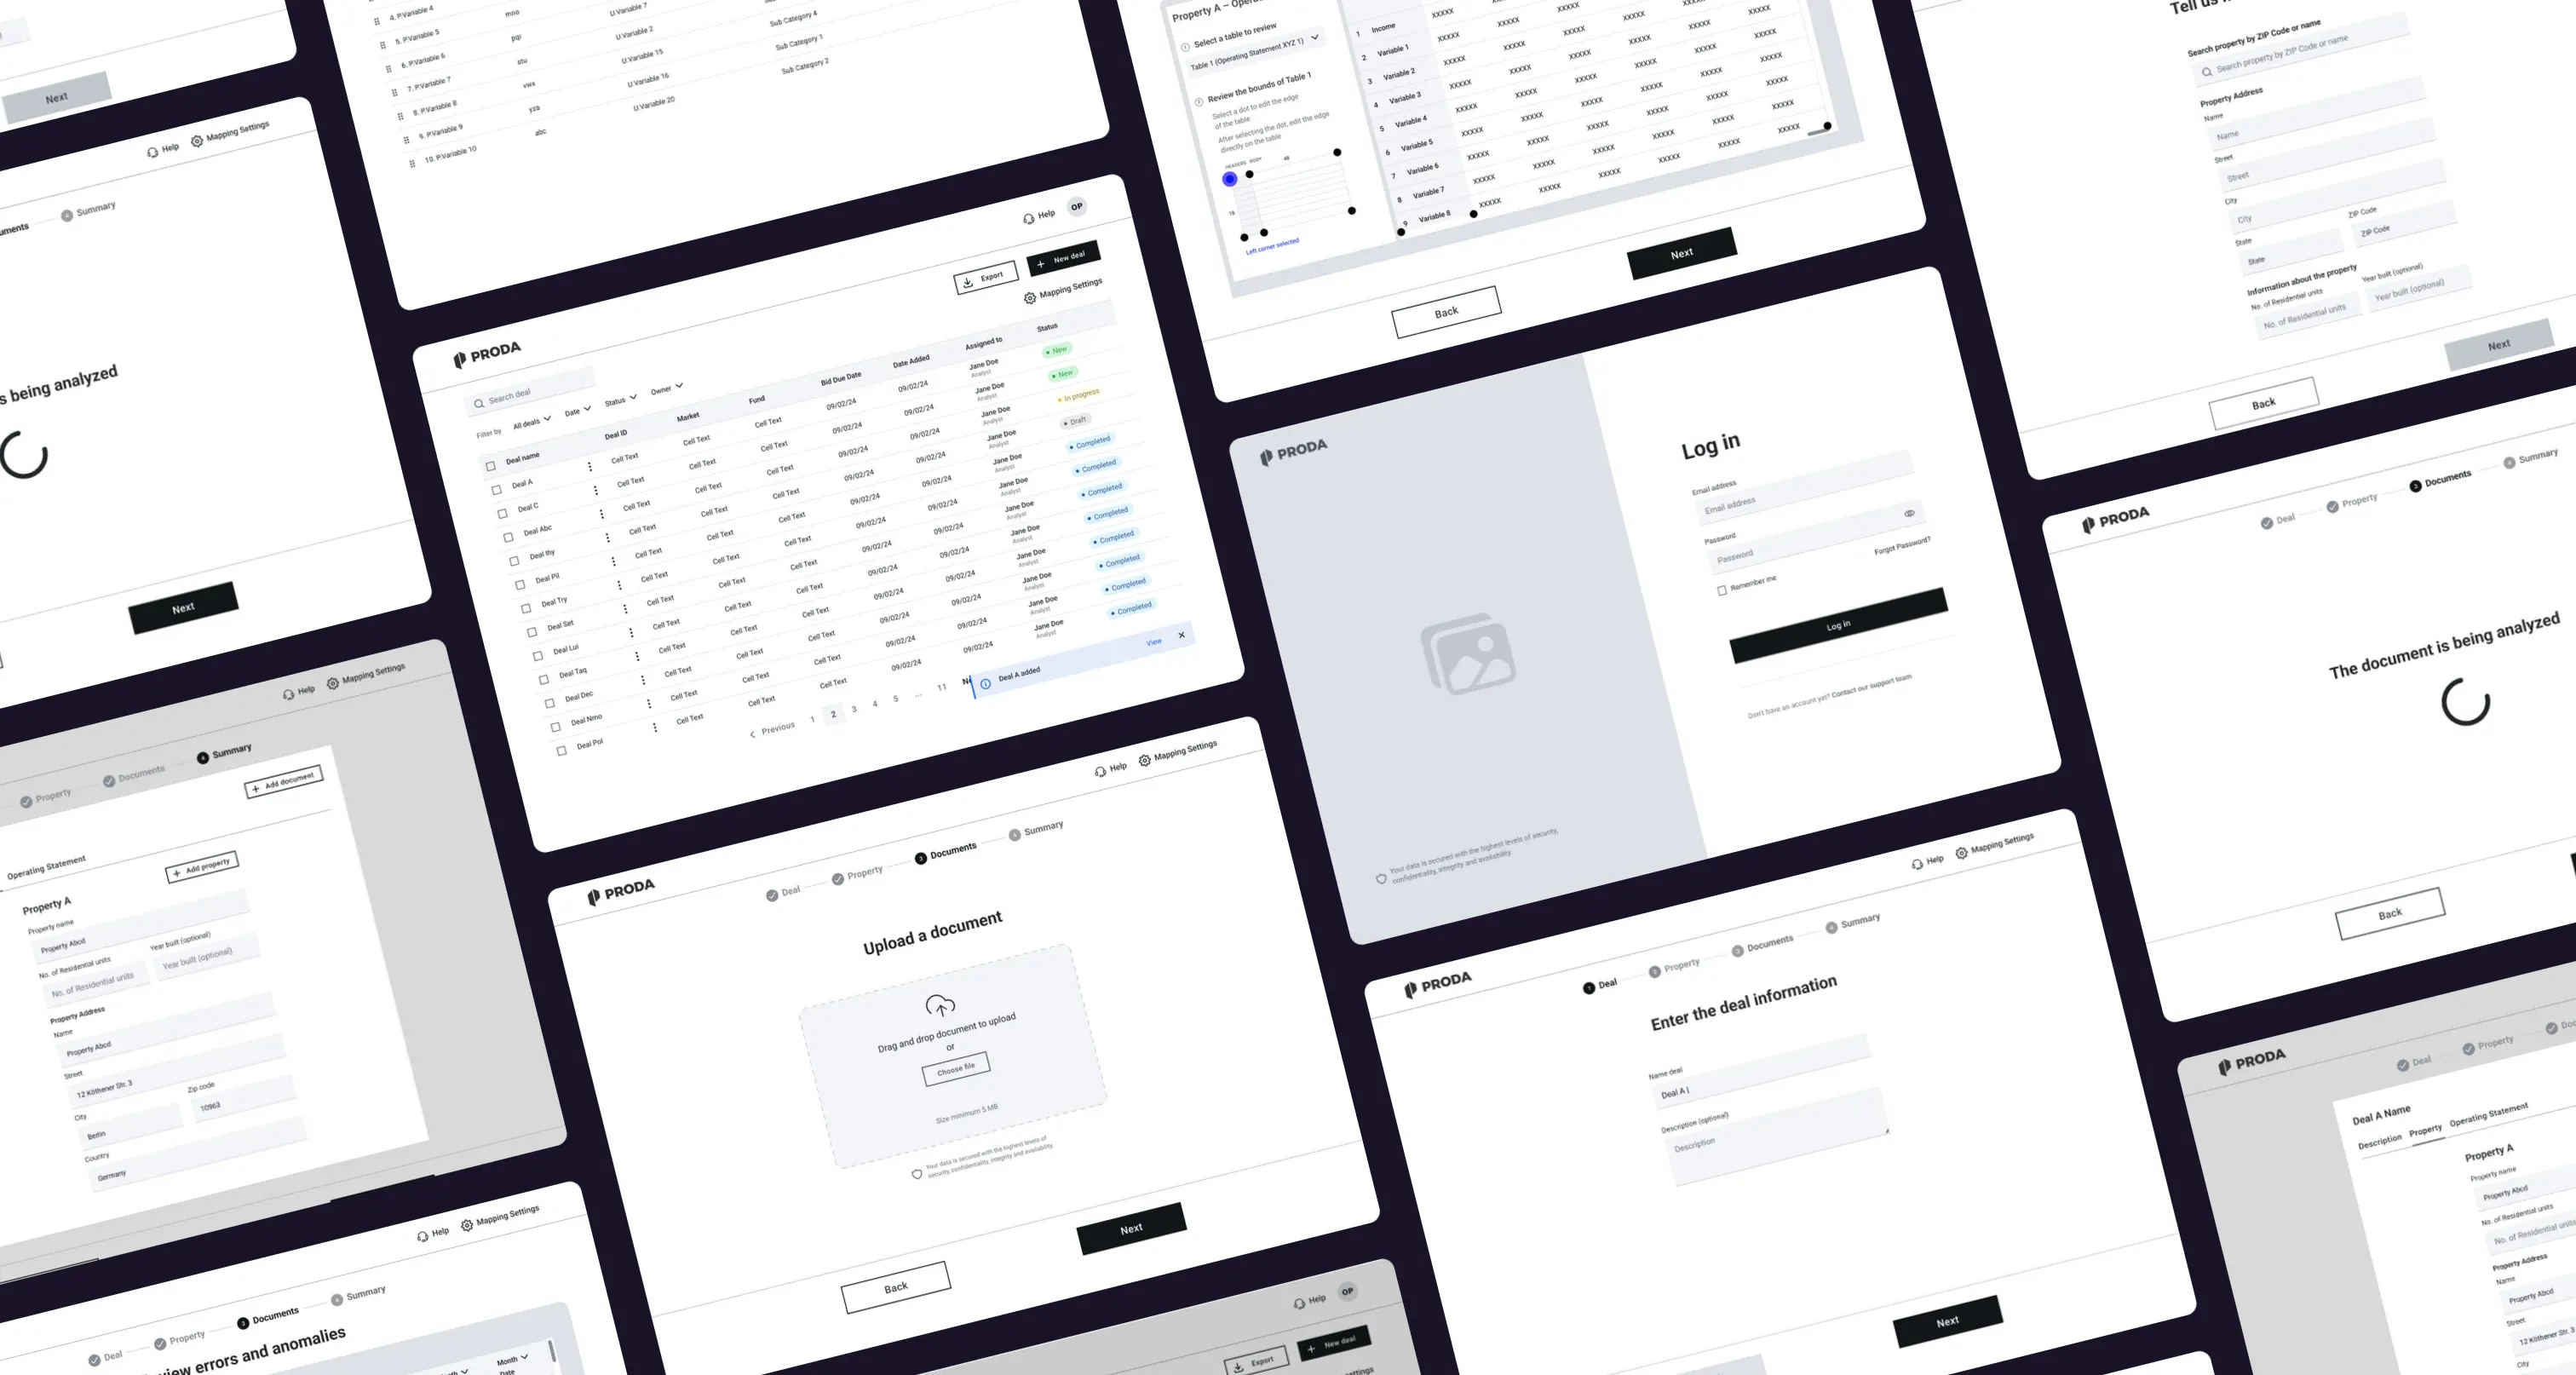
Overview
One clear place for operating statement data
PRODA is a SaaS company that helps commercial real estate teams collect, standardize and error-check rent roll and operating statement data from any source. I joined as lead product designer to design and refine a new flow for uploading and reviewing operating statements.
Using a design thinking approach, I worked closely with the product manager and engineers: we tested wireframes with users early, then refined the designs based on what we learned. I worked alongside PRODA’s design team and their design system, so every new screen stayed consistent with the rest of the product.
The impact
Testing wireframes and a prototype early meant the biggest usability issues were fixed before development, on a tight timeline.
Challenge
Financial data spread across too many places
Real estate teams were working with operating statement data split across multiple spreadsheets and platforms. Bringing it all together by hand was slow, and every manual step was another chance for an error to slip in.
The goal was to reduce that administrative overhead and make financial insights faster and more accurate to reach. We had to get there on a tight timeline, while fitting into the tools teams already relied on and meeting strict security requirements.
Fragmented data
Financial data lived across multiple spreadsheets and platforms, with no single place to work from.Manual consolidation
Pulling the data together by hand took time and introduced errors.Real constraints
Tight deadlines, existing tools and data sources, and strict security requirements shaped every decision.
Role
Leading the design, from research to delivery
I led the design of the new flow end to end: research, ideation, prototyping and delivery.
I ran the user research and competitor analysis, mapped the user journeys and created the wireframes, then designed high-fidelity interactive prototypes. Throughout, I worked closely with the PM and engineers to check feasibility and support the implementation, and with PRODA’s design team to stay aligned with their design system.
Process
From sketches to a tested prototype
Ideation and sketching
I mapped the workflows for consolidating data and building reports, then explored several layout concepts for the dashboards and data visualizations.
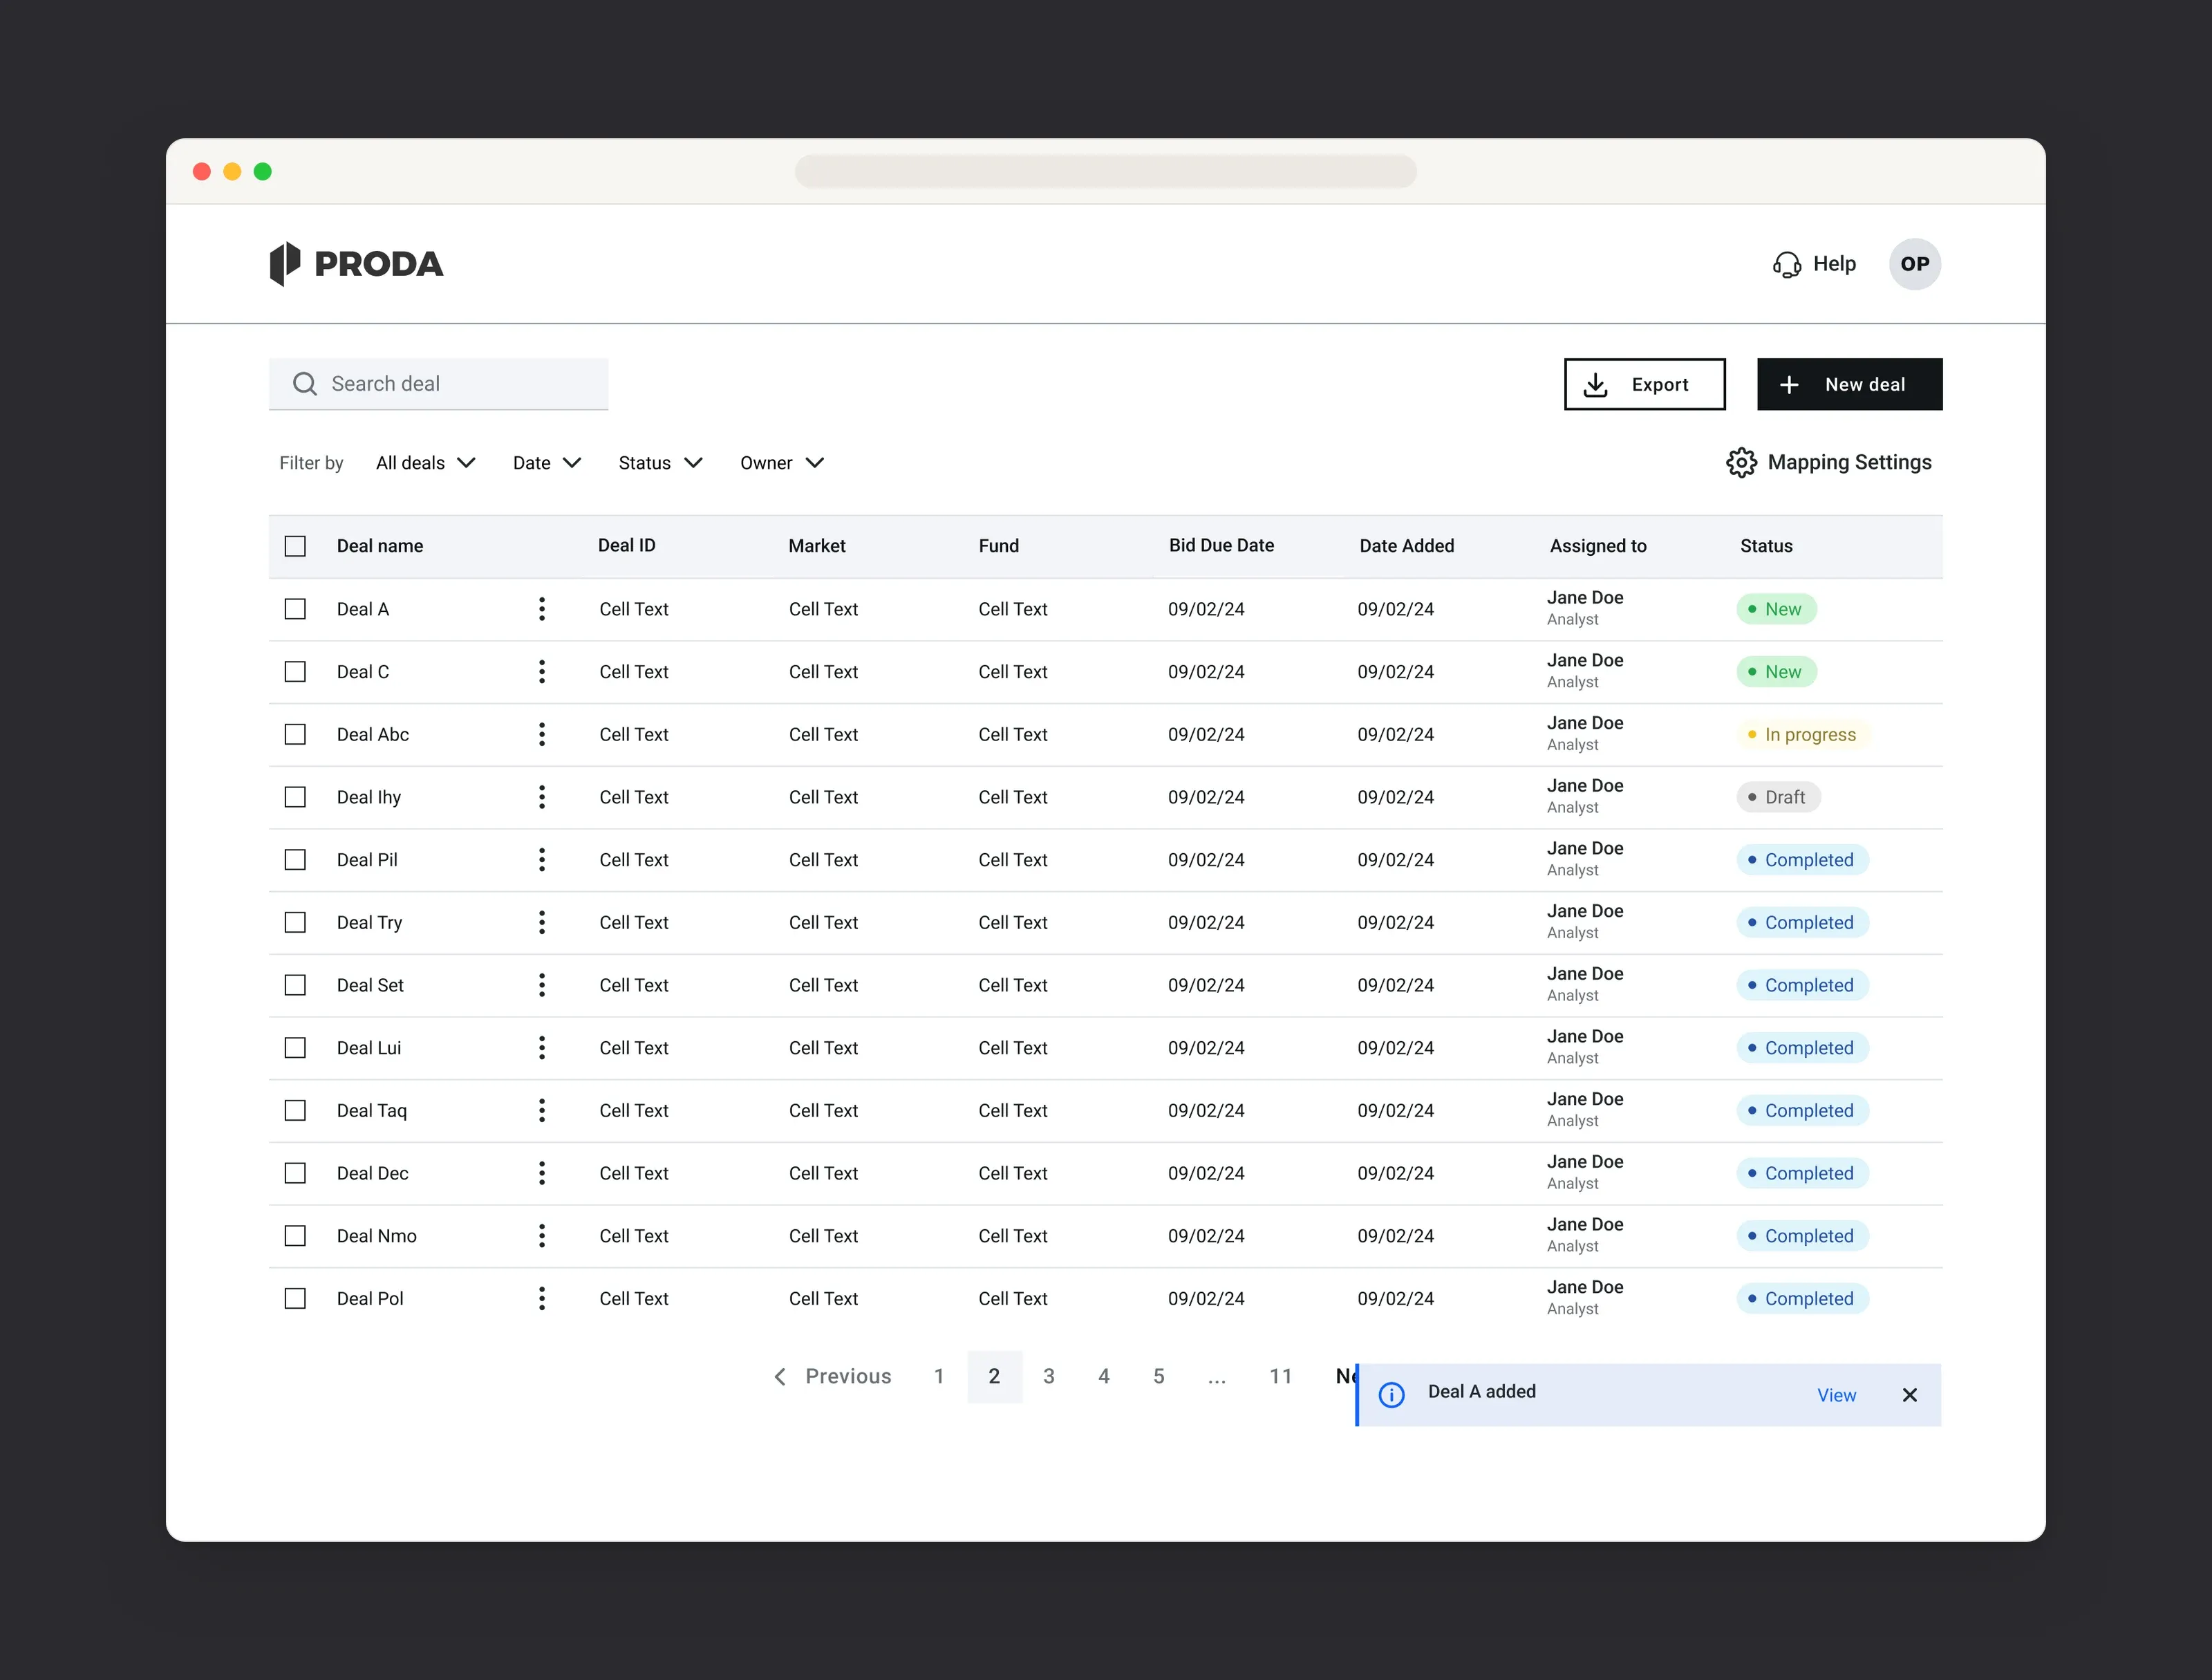
Wireframes and user flows
I created low-fidelity wireframes for the key screens and iterated on them with feedback from the PM, users and PRODA’s design team.
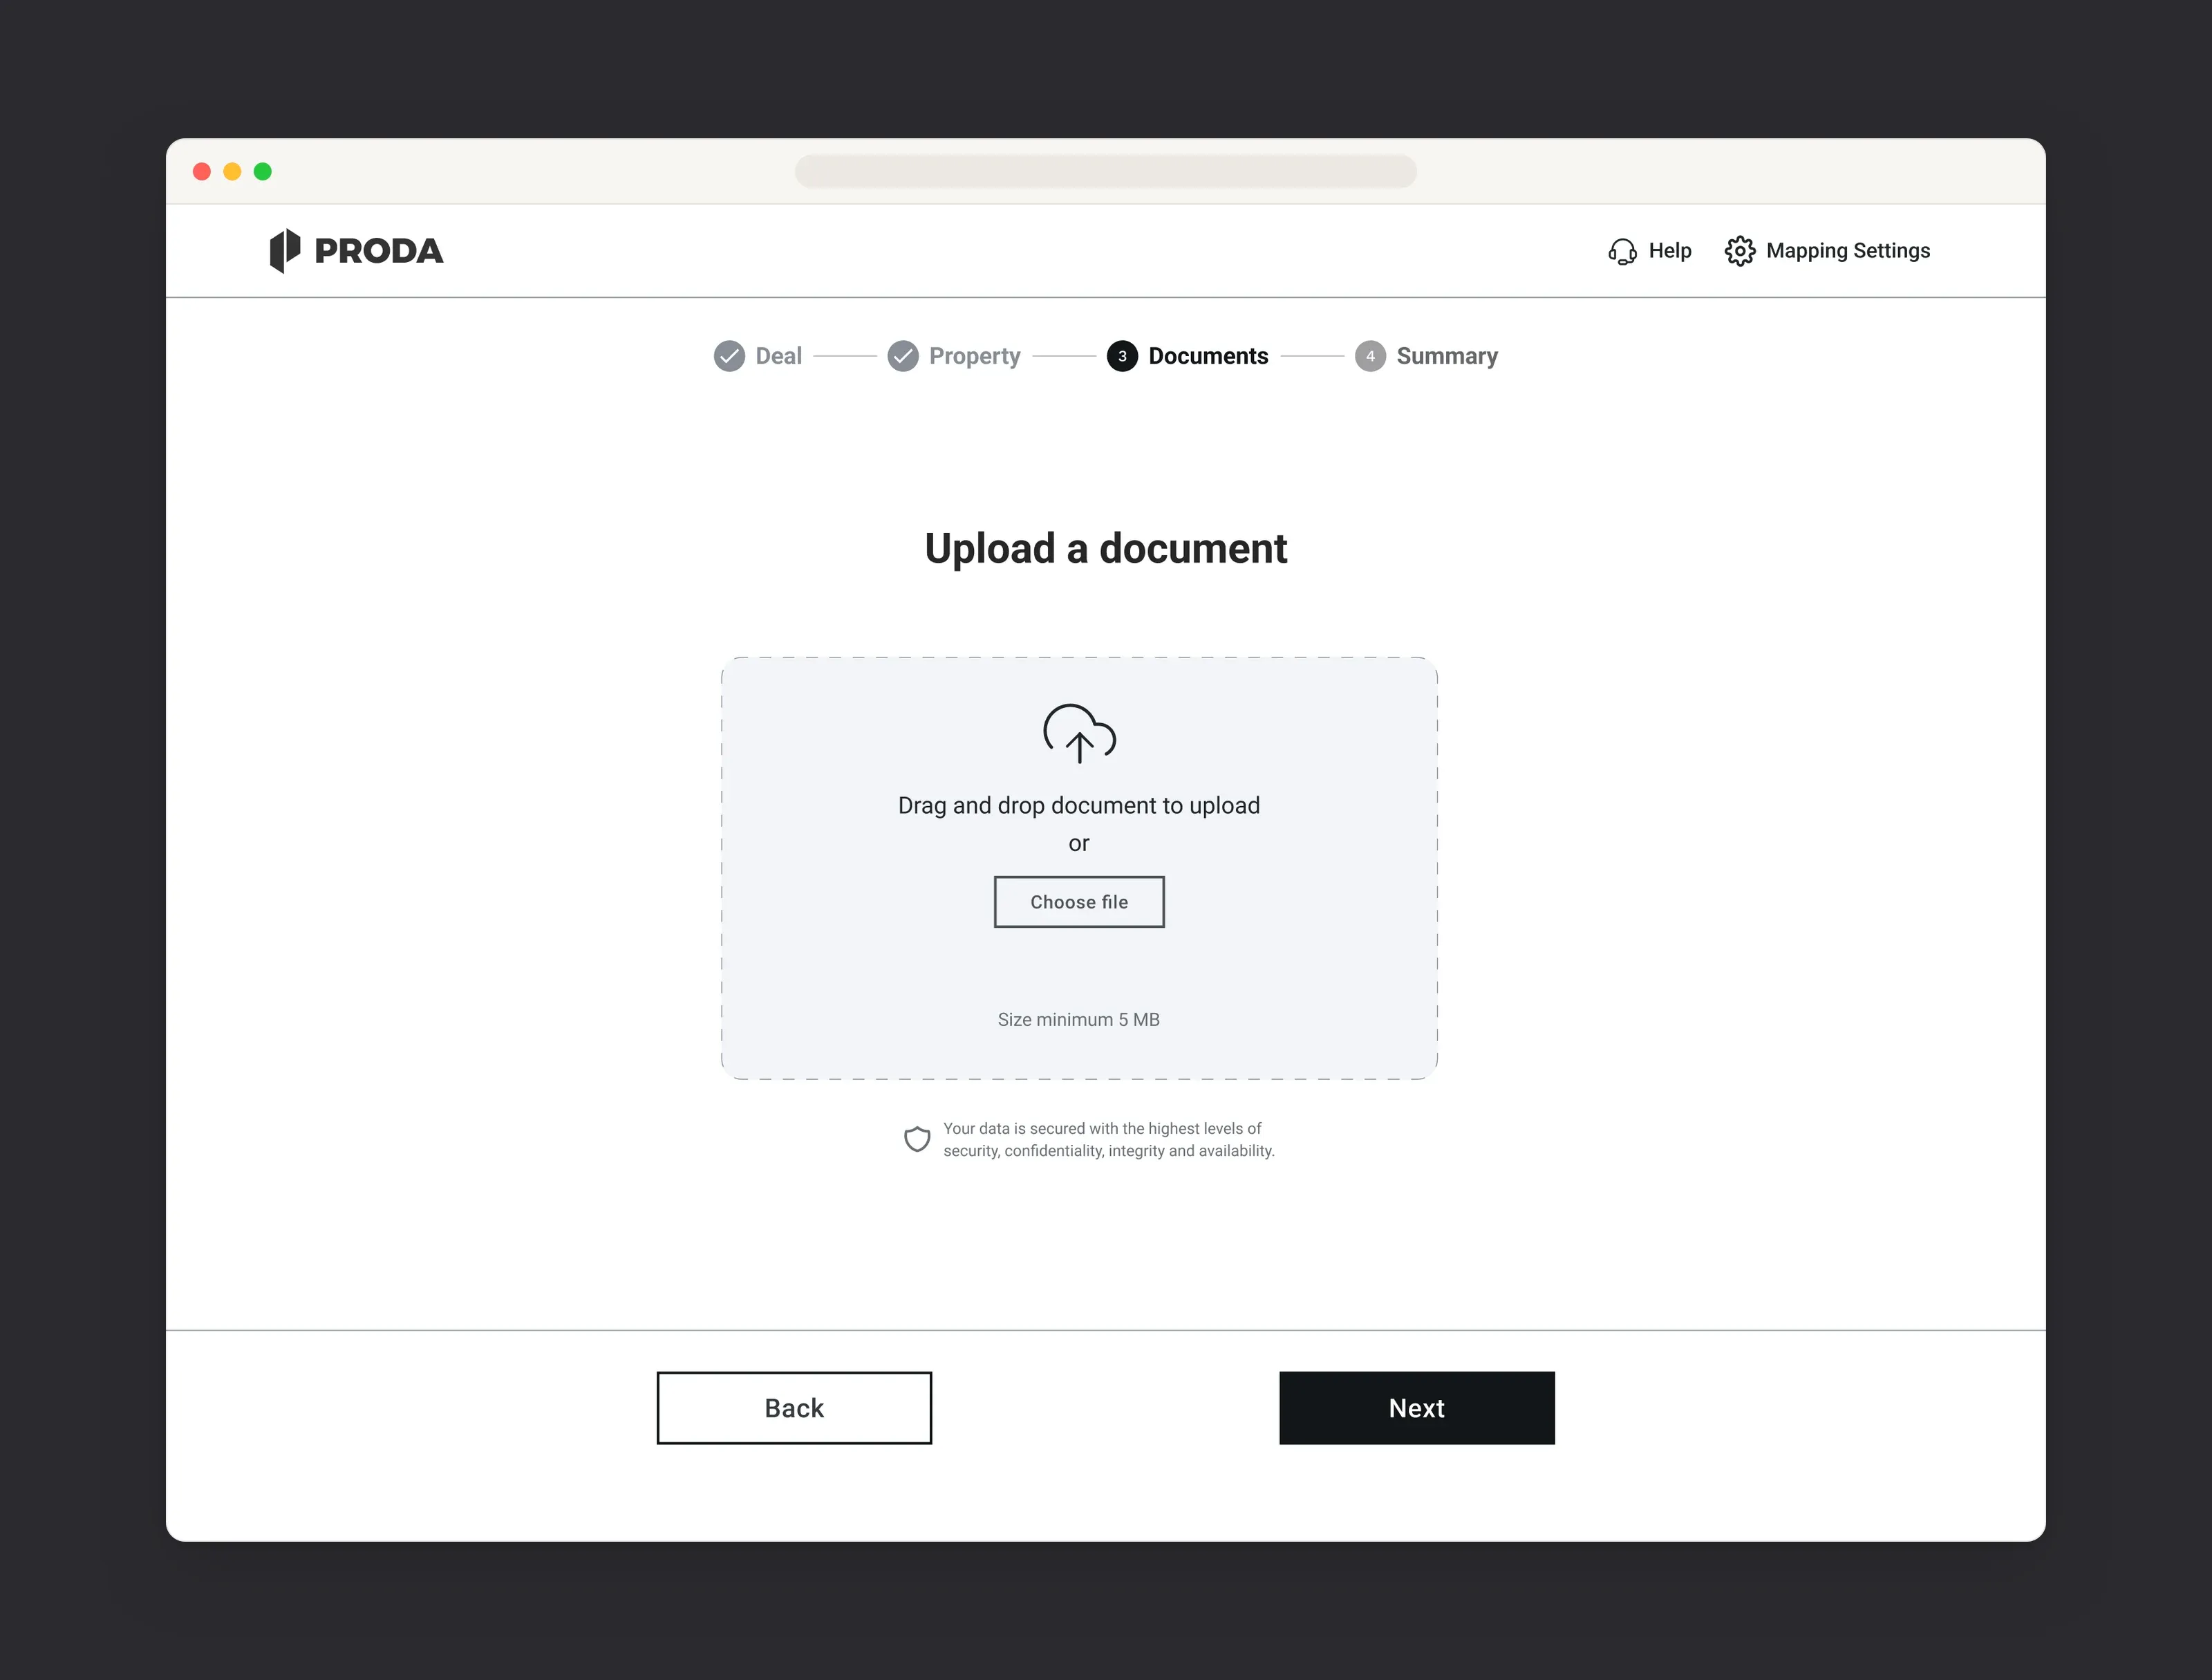
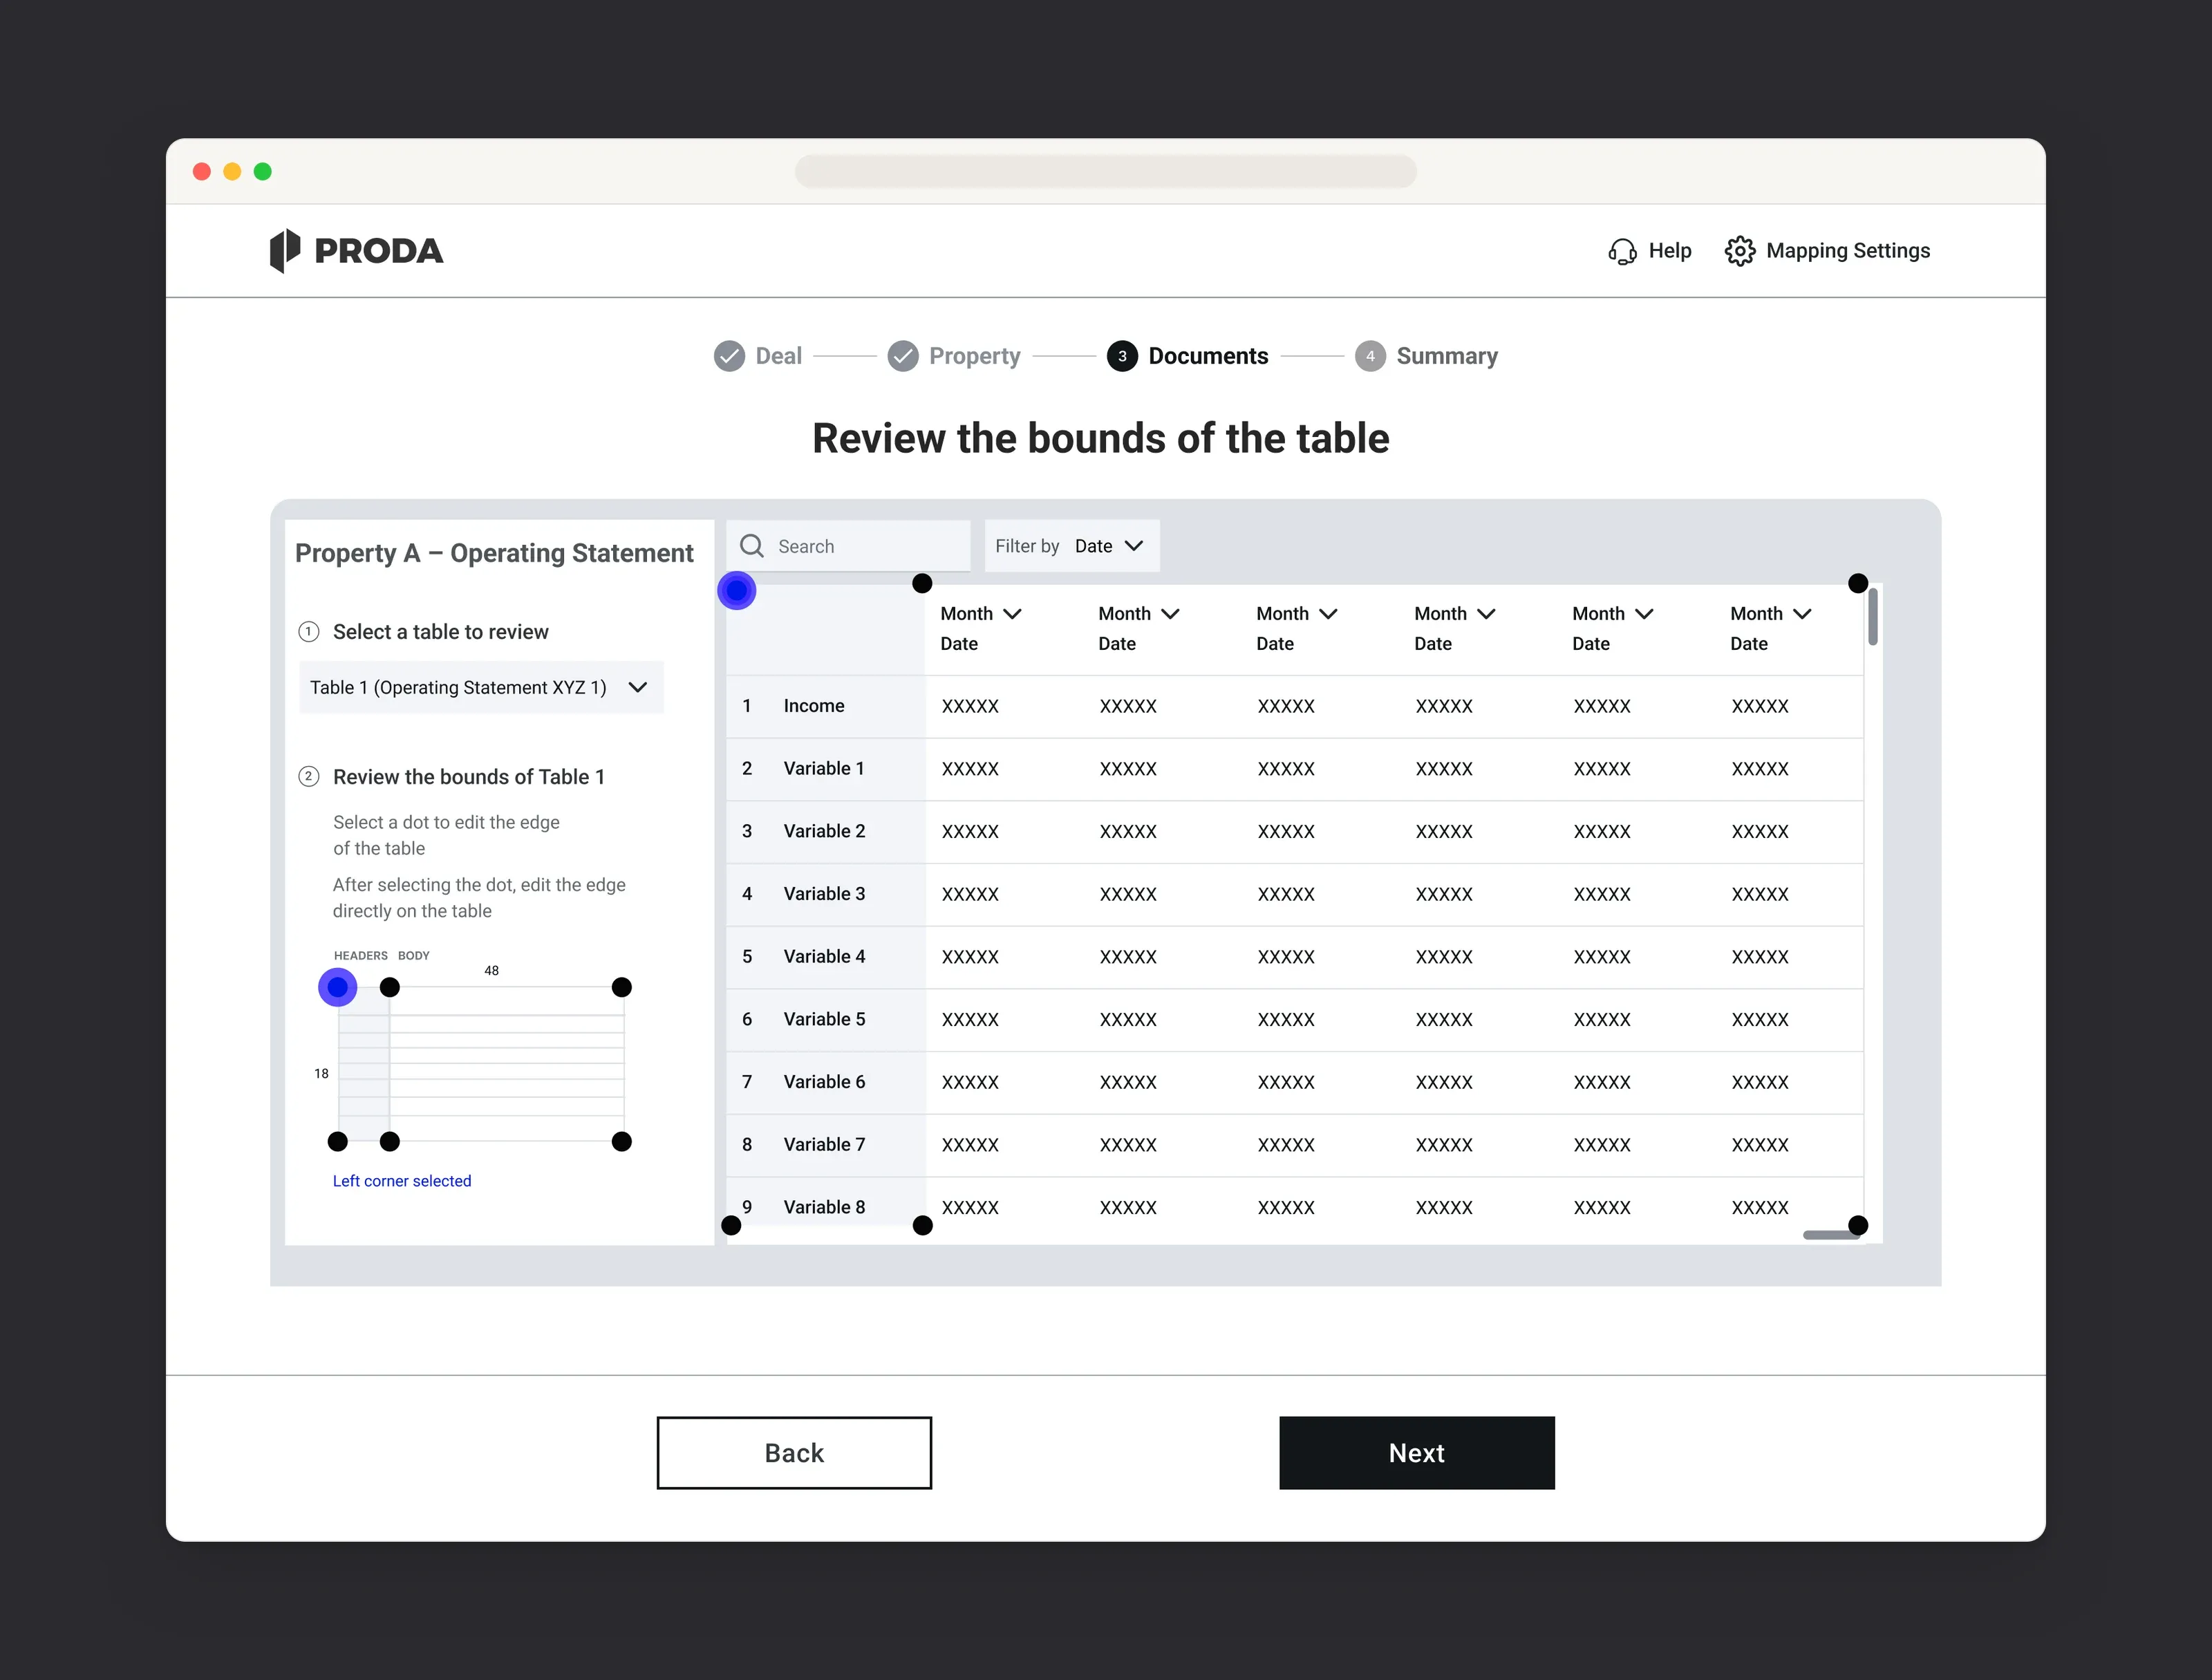
Prototyping and testing
I built a clickable prototype in Figma and ran usability tests with five users. Testing before high fidelity let us find and fix friction early, while changes were still quick to make.
Design
A dashboard built for quick, confident decisions
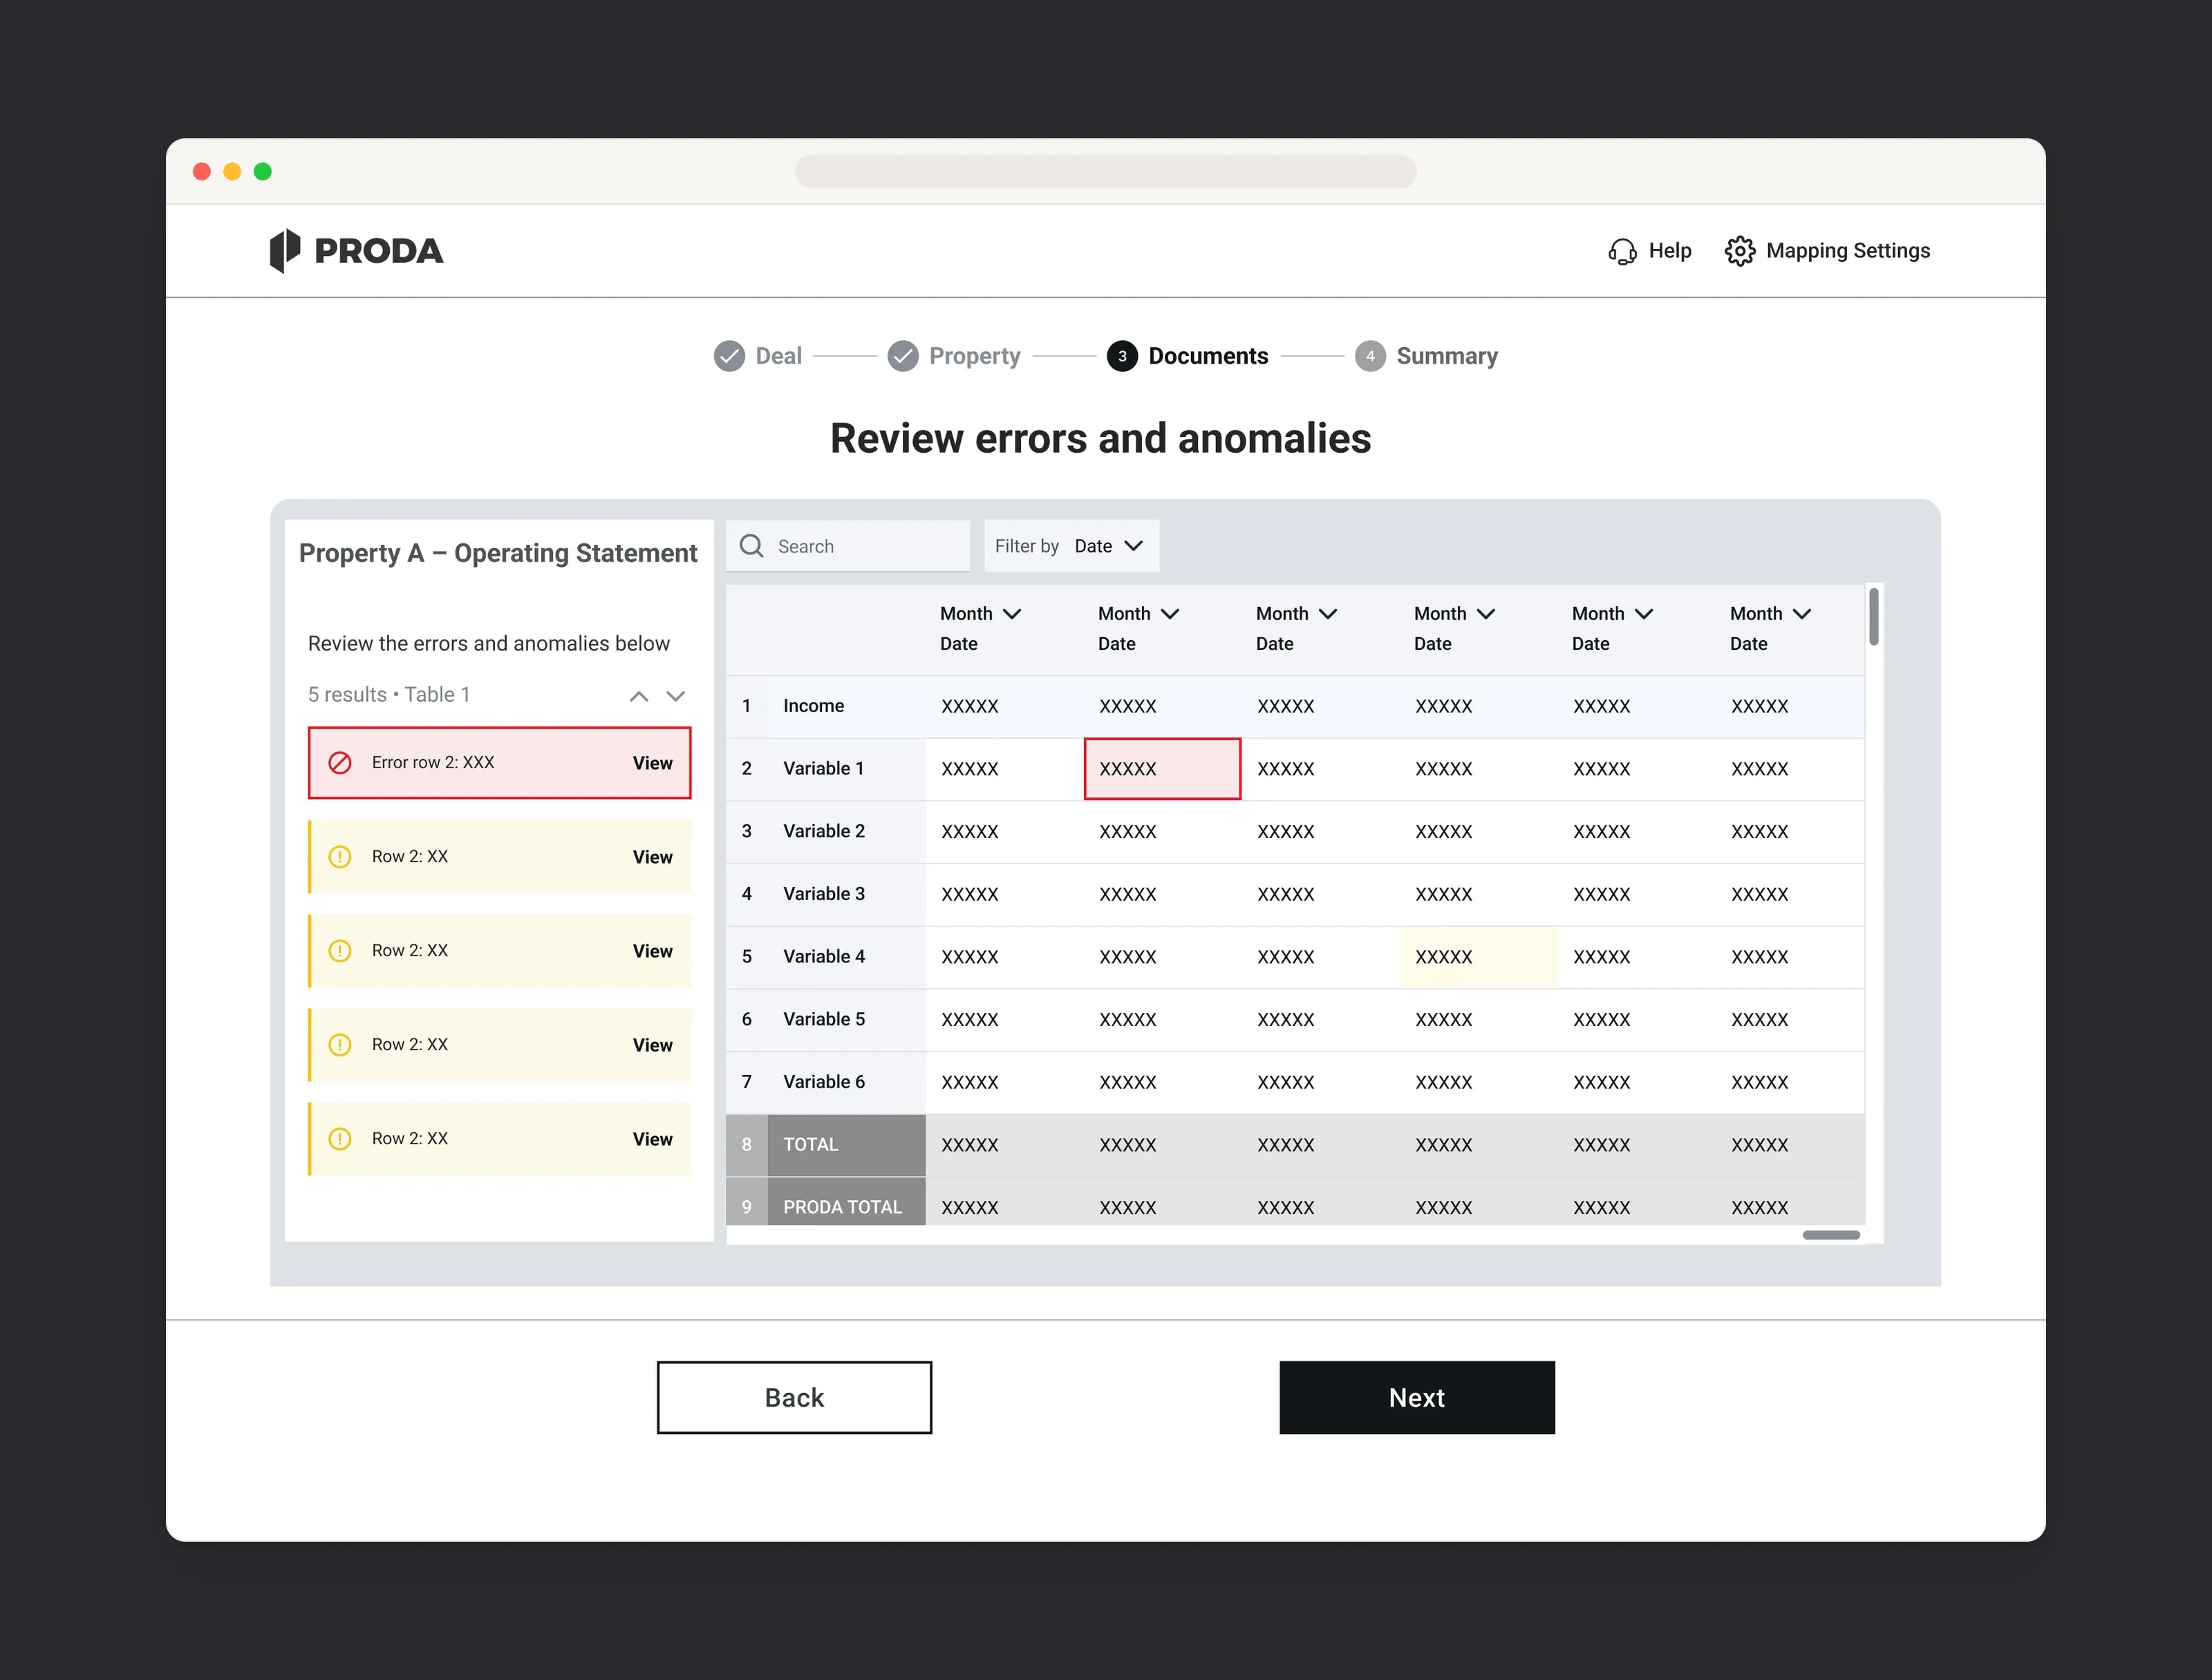
The final design is a high-fidelity dashboard that brings operating statement data into one view, so teams can check, filter and act on it without switching between tools.
Clear hierarchy
A clear visual hierarchy, filters and actionable insights, so the most important numbers stand out first.
Built to scale
Modular components that make room for future features and integrations.
Easy to read
Accessible colour contrast and clear labelling for quick comprehension.
Consistent
Built with PRODA’s design team on their existing design system, so every screen looks and behaves the same way.
Result
Problems solved before development
Testing early with wireframes and a clickable prototype meant the biggest problems were solved before development, which made a real difference on a tight timeline.